Crimson Publishers High Impact Journals

Friday, November 5, 2021

Study of Alternative Therapy with Minerals in Patients of Polycystic Ovary Syndrome_Crimson Publishers

Study of Alternative Therapy with Minerals in Patients of Polycystic Ovary Syndrome by Raj Soni in Degenerative Intellectual & Developmental Disabilities_Journal of Intellectual and Developmental Disability

Abstract

Background: Polycystic ovary syndrome (PCOS) is a common endocrine system disorder among women of reproductive age. Women with PCOS may have enlarged ovaries that contain small collections of fluid (Follicles). Alternative therapy including natural minerals has been emerging in addition to established medical and surgical treatment for PCOS. In present non-randomized, open label study, we have studied safety and effectiveness of exclusive natural mineral solution with use of reserve wellness wrapping technique in PCOS patients.

Methods: A total of 20 females (10 married and 10 unmarried) who had with PCOS were enrolled in present study. Natural Mineral powder used for study consist of mixture of Bentonite Clay, Magnesium Chloride, Magnesium Sulphate, Sodium Chloride and Zinc Oxide 2%. Patients were underwent standard study procedure. Changes in hormonal level (AMH, LH, FSH, Prolactin, TSH, Insulin resistance) measured on 3rd day of menstrual cycle pretreatment and post treatment was evaluated to assess the efficacy of study treatment. Safety was evaluated throughout study procedure by observing adverse events. Compliance to study treatment was documented on individual case report form of the patient.

Results: Study results revealed that majority of hormonal level significantly changed post treatment compared to pre-treatment. LH/FSH Ratio at pre-treatment was 2.76:1, which was reduced to 1.21:1 at post treatment (p< 0.001). Study results shown that there was statistically significant improvement in Luteinizing Hormone (LH), Prolactin, AMH, Fasting Insulin, SGPT, post treatment from the preoperative values (P< 0.05). No adverse event was reported during conduct of present study.

Conclusion: Present study procedure for PCOS treatment is found safe and efficacious without any incidence of adverse events.

Keywords: Polycystic ovary syndrome; Follicles; LH/FSH ratio

Introduction

Polycystic ovary syndrome (PCOS) is a common endocrine system disorder among women of reproductive age. Women with PCOS may have enlarged ovaries that contain small collections of fluid - called cysts s-located in each ovary as seen during an ultrasound exam [1]. PCOS is defined by hyperandrogenism (clinical or biochemical), chronic an ovulation, and/or polycystic ovaries with the exclusion of the adrenal, ovary and pituitary disorders. It is also characterized by multiple metabolic aberrations such as insulin resistance (IR) and hyperinsulinaemia, high incidence of impaired glucose tolerance visceral obesity, inflammation and endothelial dysfunction, hypertension and dyslipidemia resulting in an increased risk for diabetes and clinical or subclinical cardiovascular disease [2]. Compromised quality of life, anxiety and depression are also observed in PCOS. PCOS is now considered as a female subtype of the metabolic syndrome and its potential health consequences are a lifelong issue [2].

Polycystic ovary syndrome (PCOS) is one of the most common endocrinological disorders in women of reproductive age, occurring in 5-10% of women of reproductive age [3]. In PCOS, an ovulation relates to low follicle-stimulating hormone concentrations and the arrest of antral follicle growth in the final stages of maturation [4]. The exact cause of polycystic ovary syndrome is unknown. Early diagnosis and treatment along with weight loss may reduce the risk of long-term complications, such as type-2 diabetes and heart disease [5]. A main underlying problem with PCOS is a hormonal imbalance. In women with PCOS, the ovaries make more androgens than normal. Androgens are male hormones that females also make. High levels of these hormones affect the development and release of eggs during ovulation [5].

PCOS is caused by an imbalance in the hormones (chemical messengers) in your brain and your ovaries. PCOS usually happens when a hormone called LH (from the pituitary gland) or levels of insulin (from the pancreas) are too high, which results in extra testosterone production by the ovary. Medical treatment of PCOS with medications such as clomiphene citrate, tamoxifen, aromatase inhibitors, metformin, glucocorticoids, or gonadotropins or surgically by laparoscopic ovarian drilling is under practise. In vitro fertilization will remain the last option to achieve pregnancy when others fail. Chronic an ovulation over a long period of time is also associated with an increased risk of endometrial hyperplasia and carcinoma, which should be seriously investigated and treated. There are androgenic symptoms that will vary from patient to patient, such as hirsutism, acne, and/or alopecia. These are troublesome presentations to the patients and require adequate treatment [4].

Alternative medicine has been emerging as one of the commonly practiced medicines for different health problems. Alternative medicines include many modalities, such as kinesiology, herbalism, homeopathy, reflexology, acupressure, acupuncture, and massage therapy. Acupuncture is the most common modality. Lowfrequency EA and physical exercise improved hyperandrogenism and menstrual frequency more effectively than no intervention in women with PCOS. Low-frequency EA was superior to physical exercise and may be useful for treating hyperandrogenism and oligo/amenorrhea [4]. The benefit acupuncture seems to have for PCOS sufferers is in helping them regulate and manage their periods. However, it has also been shown to aid in weight loss and reducing headaches as well as improving patients’ moods and outlooks. Women with PCOS will have needles placed along the acupuncture meridians related to the reproductive system. This will help stimulate the organs, improve blood flow to the area, and contribute to normalizing hormone levels, and promote the proper functioning of the reproductive system [5].

Neutraceutical is ‘‘a food (or part of a food) that provides medical or health benefits, including the prevention and/or treatment of a disease”. Pietro et al. [6] reviewed that these foods can protect human body from adverse events because of the beneficial effects of some photochemical. Several studies have reported the validity of this idea in clinical practice and could be considered for patients of PCOS in addition to other treatment strategy [7]. One more approach for natural treatment is utilization of the natural mineral base containing practically every known element of the earth and taking advantage of current technology and research, there is strong possibility to improve hormonal balance in particularly PCOS patients. The wrapping process ‘contours’ the body which results in better balances hormones.

In present single centric, non-randomized, open label study, exclusive natural mineral solution and reserve wellness wrapping technique is combined to study in PCOS patients. Objective of present study is to evaluate the efficacy and safety of Natural mineral solution in treatment of polycystic ovary syndrome. Before planning study, all types of wrap solutions known to use in women were studied. Additional evaluation for known information with the techniques and processes for the purpose of balancing hormones were carried out.

Methods

Both married and unmarried female patients with Polycystic Ovary Syndrome (PCOS) who are willing to sign a copy of the written Informed Consent form and agree to attend all follow-up appointments were included in present study. Pregnant females and females with Phlebitis and/or Emphysema were excluded from study. Patients with allergies to metal mined from earth or any study Ingredient and who had undergone any major surgery in last 3 months were also excluded from this study. Post Natal and lactating women, patients with cancer, lupus and Heart problems, Epilepsy, Hypertension, Hypotension, Skin Diseases or Disorders, Diabetes and Asthma were wrapped in study with special precautions.

Present study was conducted in accordance with the ethical principles that have their origins in the Declaration of Helsinki along with the local regulatory requirements of GCP for Clinical Research in India, Schedule Y, ICMR guidelines for Biomedical Research on Human Patients (2006) and all relevant SOPs of Study centre. Ethical approval of study documents was obtained from ethics committee in written before conduct of study, as per regulatory requirement. Details of the study such as objectives, procedures, risks, benefits, restrictions and requirements of the study was presented to all the patients in a language that the patient best comprehended. The patients were given ample time to read the ICF followed by explanation by the study personnel. All the queries of the patient were resolved before obtaining the consent. All patients were encouraged to ask questions and all the questions were fully answered. Study specific written informed consent was obtained from each patient before enrolling into the study.

A total of 20 females (10 married and 10 unmarried) who fulfilled predefined inclusion/exclusion criteria were enrolled in present study. Baseline demography of Patient age, height and weight was recorded for individual patients. Patients were underwent study procedure and efficacy data were collected at pre study and post study treatment. Natural Mineral powder used for study consist of mixture of Bentonite Clay, Magnesium Chloride, Magnesium Sulphate, Sodium Chloride and Zinc Oxide 2%. Study was single arm pen label study with only one treatment arm so method of Assigning Patients to Treatment Groups is not applicable. Individual patient was given prescheduled appointment and asked to visit clinic for study procedure which was done for approximately 1 hour and repeated every 4th day for 1 complete menstrual cycle. Treatment was recommended to be taken after 2 hours of Lunch. Patients were advised not to apply any type of body cream, lotion, deodorant or perfume, bath soap, and body powder while duration of study. Patient had to drink at least 12 to 14 glass of water after treatment every day.

Total of approximately 30Nos. of bandages were soaked in specialized water heating tank along with 1kg Mineral powder in 4.5 litres of water at least for 60min. At every 15min., bandages were turned around in water heating tank so that all minerals were getting absorbed by elasticated cotton bandages. Participants were be wrapped from neck to toe, from legs upwards and then covered with Vinyl suit, to maintain body temperature. The patients were remained in lied down position for one hour.

After one hour, Vinyl suit is removed and after unwrapping the patient wipe the body. Patients were not advised to take even shower after treatment. Treatment was recommended to be taken after 2 hours of Lunch. Patients were advised not to apply any type of body cream, lotion, deodorant or perfume, bath soap, and body powder while duration of study. Patient had to drink at least 12 to 14 glass of water after treatment every day.

Compliance to study treatment was documented on individual case report form of the patient. 5ml blood was collected on 3rd day of menstrual cycle to investigate hormonal level in individual patient at baseline (before treatment) and post treatment (3rd day of next menstrual cycle). Laboratory investigation for hormones AMH, LH, FSH, Prolactin, TSH, Insulin resistance was performed for efficacy evaluation. Efficacy was evaluated by Improvement in hormone balance (AMH, LH, FSH, LH/FSH ratio, Prolactin, TSH and Insulin resistance). Safety was evaluated throughout study procedure as well as at end of study. Safety was evaluated by analyzing number of adverse events and patients with adverse events.

Sample size was not formally calculated for present study, considering study. Statistical analysis was performed using SPSS software. Frequency (N), Mean (SD), Minimum, Maximum values were reported for continuous variables. Frequency and percentage were displayed for categorical variables. Statistical significance for efficacy variables were evaluated between pre study mean value and post study mean by paired t test. There was no protocol deviations reported during conduct of study. None of patient was discontinued from present study.

Results

Table 1:Baseline demographic characteristics (N=20).
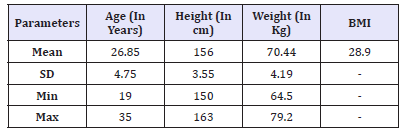

All enrolled (twenty) patients had completed study and were included for safety and efficacy analysis. Proportion of married and unmarried patients were equal (50%) in present study. Mean age of patients enrolled in present study was 26.85±4.75 Years (Range 19- 35 Years). Mean, S.D., Minimum-Maximum of Age (In Years), Height (In cm), Weight (In Kg) and BMI at baseline is presented in Table 1.

Efficacy results

Changes in hormonal level measured on 3rd day of menstrual cycle pre-treatment and post treatment was evaluated to assess the efficacy of study treatment. Study results revealed that majority of hormonal level significantly changed post treatment compared to pre-treatment. There was statistically significant improvement in Luteinizing Hormone (LH), Prolactin, anti-mullerian hormone (AMH), Fasting Insulin, SGPT and LH/FSH ratio, post treatment from the preoperative values (P< 0.05).

Baseline Mean Value of FSH was 4.18±0.76 which was normal and remained almost unchanged (Mean value 5.20±0.94) post treatment. P-value provided by statistical comparison of FSH level by paired t-test is 0.131 which revealed that there is no statistically significant difference at post treatment.

Baseline Mean Value of LH was 11.52±2.16 which was normal and persisted in normal range (Mean value 4.27±0.65) post treatment. P-value provided by statistical comparison of LH level by paired t-test indicated highly statistically significant difference at post treatment in LH level. LH/FSH Ratio at pre-treatment was 2.76:1 which was high compared to healthy female with usual hormonal level, which was reduced positively to 1.21:1 at post treatment. This reduction is significant clinically as well as statistically (p< 0.001).

Baseline Mean Value of TSH was 3.63±0.65 which was normal and stable (Mean value 3.62±0.64) at post treatment. There is no statistically significant difference at post treatment in TSH value (p=0.207) compared to pre-treatment.

Initial prolactin level pre-treatment was little higher (Mean 36.36±1.94) at baseline was reduced to normal level with mean value 29.35±1.32 at post treatment (p< 0.001). AMH level was observed normal (Mean 6.79±0.18) at post treatment which was found higher than normal at baseline (Mean 10.84±1.25, p< 0.001),

Fasting Insulin Mean Value was normal at pre-treatment as well as post treatment and stable (p=0.018). Initial SGPT level pre-treatment was little higher (Mean value 35.83±1.41) at baseline was reduced to normal level with mean value 29.40±1.68 at post treatment (p< 0.001). Comparison of pre-treatment and post treatment mean value with S.D. is presented in Table 2. Pretreatment and post treatment mean value of each hormonal level is depicted in Figure 1. Study results had shown that all hormonal levels had reduced little or more at post treatment except FSH level. LH/FSH ratio was also significantly reduced. Mean change of hormonal level at post treatment compared to pre-treatment is presented in Table 3. Treatment Compliance was evaluated and documented by record of menstruation date and clinic treatment dates in CRF of each patient. Most of patients received seven (n=12) or eight times (n=6) study treatment. Details of patients receiving respective number of treatment are provided in Table 4. Study results favoured effectiveness of mineral therapy in treatment of patients with PCOS.

Table 2:Baseline demographic characteristics (N=20).
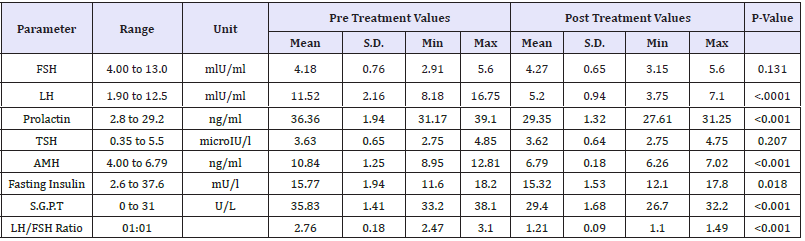

Figure 1:Comparison of pre-treatment and post treatment hormonal level.
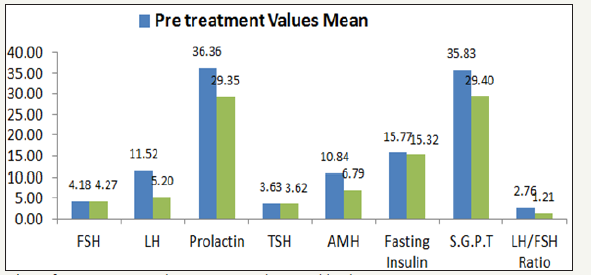

Table 3:Post treatment reduction in hormonal level compare to pre-treatment (Efficacy Population).
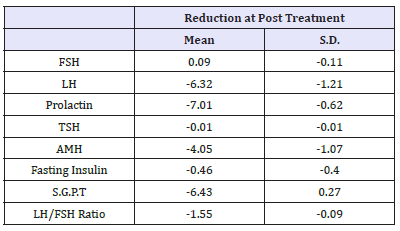

Table 4:patients received treatment


Safety results

All 20 patients were exposed to study treatment and were included in safety analysis. No adverse event was reported during conduct of present study. Present study procedure for PCOS treatment is found safe and well tolerable without any incidence of adverse events.

Discussion

The present study was performed to evaluate safety and efficacy of alternative therapy with minerals in patients of PCOS. Exclusive natural mineral solution and reserve wellness wrapping technique is combined to study in PCOS patients. Before planning study, all types of wrap solutions known to use in women were studied. Additional evaluation for known information with the techniques and processes for the purpose of balancing hormones were carried out. Mineral solution base used in present study is natural minerals. Individual mineral have shown advantageous role in PCOS patient as a natural therapy but specific combination of minerals with welldesigned specific technique was not studied till date. Present study was carried out on hypothesis of utilizing the natural mineral base containing practically every known element of the earth and taking advantage of current technology and research, there is strong possibility to improve hormonal balance in particularly PCOS patients.

Hormones play vital role in female reproduction system. Improvement in hormonal balance may beneficial in many gynaecological diseases including Polycystic ovary syndrome (PCOS). There was statistically significant improvement in Luteinizing Hormone (LH), Prolactin, AMH, Fasting Insulin, SGPT and LH/FSH ratio, post treatment from the preoperative values (P< 0.05).

We have not placed any patients on diet change or any life style modifications. So, weight and BMI was not studied at end of treatment. LH/FSH Ratio at pre-treatment was 2.76:1 which was high compared to healthy female with usual hormonal level, which was reduced positively to 1.21:1 at post treatment. This reduction is significant statistically (< 0.001). In healthy females, generally this ratio may be near to 1:1, so study results are approaching towards positive clinical aspects. Any complications or adverse events were not reported in present report denoted the safety of this procedure.

Both married and unmarried females were included in present study equally. Sample size of 10 married and 10 unmarried females were quite less and insufficient to establish proof of concept for efficacy and safety.

In conclusion, use of natural minerals with specific study procedure is a safe measure with promising primary study results for polycystic ovary syndrome (PCOS) for treatment of hirsutism, at least in the short term as demonstrated by this study. This method is technically simpler, cheaper and less invasive than other therapies proposed for polycystic ovary syndrome (PCOS). Mineral treatment may also be helpful for treatment of infertility. Further studies with more patients and longer follow-up to verify the stability of the induced effect are recommended to investigate further efficacy including fertility rate and pregnancy in PCOS patient population.

Limitation

Controlled clinical trials generally carried out as randomized allocation of treatment, either with active comparator or placebo, by equalising some factors that have not been accounted for in the experimental design e.g. a group of people with a health condition, different from the disease under study. In present study, lack of randomization may have bias, which is suspected to affect treatment efficacy and limitation of study. One another major limitation is lack of statistical consideration of sample size. Data generated from small group of patients could not reliable as results while larger exposure in patients may be different due to patient variability. Ideally, multivariate regression analysis should be performed in order to evaluate the role of confounding factors on results but less number of sample sizes is limiting factor for such post-hoc analysis. As researcher wanted to conduct this study as basis, future studies with randomized controlled and ideal study design are recommended to confirm outcomes of present study. Neutraceuticals is ‘‘a food (or part of a food) that provides medical or health benefits, including the prevention and/or treatment of a disease’’.

Acknowledgement

We would like to thank Mr. Suresh Bhatol and Ethi trials Clinical research Pvt. Ltd. for valuable support in writing manuscript

Funding

All funding for present study was provided by Reserve wellness.

Ethical Approval

Ethical approval for conduct of study was received from ethics committee before conduct of study.

References

  1. Mayo Clinic (2016) Diseases and conditions polycystic ovary syndrome (PCOS).
  2. Bargiota A, Diamanti KE (2012) The effects of old, new and emerging medicines on metabolic aberrations in PCOS. Ther Adv Endocrinol Metab 3(1): 27-47.
  3. Turan V, Sezer ED, Zeybek B, Sendag F (2015) Infertility and the presence of insulin resistance are associated with increased oxidative stress in young, non-obese Turkish women with polycystic ovary syndrome. J Pediatr Adolesc Gynecol 28(2): 119-123.
  4. Jedel E, Labrie F, Odén A, Holm G, Nilsson L, et al. (2011) Impact of electroacupuncture and physical exercise on hyperandrogenism and oligo/ amenorrhea in women with polycystic ovary syndrome: a randomized controlled trial. Am J Physiol Endocrinol Metab 300(1): E37-E45.
  5. Badawy A, Elnashar A (2011) Treatment options for polycystic ovary syndrome. Int J Womens Health 3: 25-35.
  6. Pietro S, Matteo C, Maria M, Pietro AM, Maria LM, et al. (2013) Nutraceuticals and dyslipidaemia: beyond the common therapeutics. Journal of Functional Foods 6(2014): 11-32.
  7. Woman’s Health (2016) Polycystic ovary syndrome (PCOS).

Wednesday, November 3, 2021

Elevated Serum Delta Bilirubin Might Predict the Occurrence of Different Types of Jaundice with Special Reference to Chronicity of the Disease_Crimson Publishers

Elevated Serum Delta Bilirubin Might Predict the Occurrence of Different Types of Jaundice with Special Reference to Chronicity of the Disease by Subhadip Choudhuri in Developments in Clinical & Medical Pathology_Journal of Medical Pathology

Abstract

Background: Present study was aimed to evaluate whether measurement of serum delta bilirubin and albumin level predict the chronicity and subsequent impaired hepatic function across the spectrum of different types of jaundice.

Methods: Serum total bilirubin, Delta bilirubin, albumin and GGT activity was measured by reflectance spectrophotometry.

Result: Decreased serum albumin was found in a significant inverse correlation with elevated delta bilirubin level among the subjects with obstructive (r=-0.4217, p=0.0023) and hepatic jaundice (r=-0.4214, p=0.0023).

Conclusion: Significant inverse relationship between elevated delta bilirubin and lower albumin level might indicate that the chronicity of the disease may be the predominant factor in hepatobiliary obstruction or hepatocellular injury that may worsen the pathology of obstructive or hepatic jaundice.

Keywords: Delta bilirubin; Albumin; Obstructive jaundice; Hepatic jaundice; Total bilirubin

Introduction

Jaundice, a pathophysiological term used to describe an increase in the amount of bilirubin in the body [1]. However, the major causes of pathological jaundice include blood incompatibilities and diseases, hereditary syndromes, several forms of hepatitis, cirrhosis of the liver and other liver diseases, bile duct blockage along with infections and certain drug medications [2,3]. Although, liver a large complex organ that is well designed for performing a pivotal role in central metabolism, bio molecule synthesis and excretion [4]. Conjugate bilirubin, a water-soluble molecule, selectively absorbed by liver hepatocytes and still considered as one of the major decisive factors to assess the excretory function of a liver. In contrast, unconjugated bilirubin is an endogenous anion derived from haemoglobin degradation from the erythrocyte, which is a hydrophobic part of bilirubin, transported through the blood bound to serum albumin, and once it arrives in liver became conjugated with glucuronic acid by the reaction catalysed by the enzyme UDP-glucuronyl transferase [5,6]. Serum albumin, a major plasma protein is frequently employed as an indicator of the hepatocyte’s ability to carry out synthetic function of liver. However, serum albumin level does not alter in mild liver damage, but readily declines in the face of sub-massive liver necrosis [7]. Conversely, γ Glutamyl transpeptidase (GGT), a membrane bound glycoprotein enzyme, catalyses the transfer of γ glutamyl group to other peptides, and found large amounts in the kidneys, pancreas, liver and intestine. Earlier studies have suggested that GGT is frequently increased in acute hepatitis and also in cholestasis. Although, GGT does not rise with bone disease or active growth as occurs with alkaline phosphatase, and in such situation measurement of GGT serve as a useful marker in the diagnosis of cholestatic disorders [8,9].

It has been found in certain sera that contains a third bilirubin species referred to as delta-bilirubin, which forms by spontaneous transesterification of bilirubin glucuronide esters to exposed carboxyl groups on various serum proteins (mainly on albumin) among the subjects with cholestasis [10,11]. Delta-bilirubin is a nontoxic and nonenzymatic covalently bound complex with albumin, has a long half-life irrespective of hepatorenal function, which is excreted neither in urine nor in bile [12]. However, total bilirubin, direct or indirect bilirubin, albumin and GGT have already been recognized as biomarker for differentiation and pattern of haemolytic, hepatic or obstructive jaundice. They are also helpful to assess the severity of the disease and predict the outcome of certain liver disorders [13,14]. But, to the best of our knowledge, there are no ample amount of data has been evaluated to elucidate the exact association of serum delta bilirubin level and impaired excretory or synthetic function of liver in the context of obstructive, hepatic or haemolytic jaundice. Hence, the study was intended to investigate serum delta bilirubin level and impaired hepatic function across the spectrum of jaundice i.e. haemolytic, hepatic and obstructive, and to evaluate the exact relationship of delta bilirubin and total bilirubin or albumin or GGT activity in different types of jaundice.

Materials and Methods

Study subjects

In the present observational case control study, we have enrolled 50 subjects with chronic obstructive jaundice (more than three-month duration), 50 patients with hepatic jaundice (acute or chronic) and 50 individuals those who have haemolyticjaundice. Further, 50 control subjects were enrolled in this study without having any hepato biliary disorder but admitted due to routine health check-up. Age, sex and blood pressure were matched among all the enrolled study subjects. Subjects having neonatal hyperbilirubinemia, drug induced hepatitis, alcoholic or non-alcoholic fatty liver disease, hepatic carcinoma, Wilson’s disease and Gilbert syndrome were excluded from this study. Obstructive, hepatic or haemolytic jaundice were diagnosed by the documentation of patient clinical history, radiological and other lab medicine-based investigations. Patients admitted or attending the medicine or gastroenterology OPD clinic of Calcutta Medical Research Institute (CMRI), Kolkata were considered for the study. Enrolled study subjects, those who fulfilled all the inclusion and exclusion criteria were finally enrolled in this study. All the subjects enrolled in this study were belonging to same geographical area (Gangtic Delta), Eastern India. The study protocol was approved by the institute’s ethical committee. The study protocol was explained to all the considered patients and only those who gave informed written consent were finally included.

Sample collection and processing

Venous blood samples (4ml in clot vial, collected after 8 hours fast and physical rest for 30 minutes) were centrifuged at 3000rpm for 10 minutes at 4 °C temperatures to separate cellular components to collect serum from clot vial. Serum samples were collected in cryocube vials for the estimation of serum total bilirubin, direct and delta bilirubin, albumin and GGT.

Total bilirubin

Total bilirubin was measured by photometry in Vitros 250 system (Ortho-Clinical Diagnostics, Johnson & Johnson, Buckinghamshire, United Kingdom). The method uses dyphylline to separate unconjugated bilirubin from albumin. Unconjugated bilirubin, conjugated bilirubin, and albuminlinked bilirubin (delta) subsequently react with the diazonium salt 4-(N-carboxymethylsulfonyl) benzenediazonium hexafluorophosphate to produce azobilirubin chromophores that have similar molar absorptivities and absorbance maximum around 520nm. The concentration of total bilirubin is determined by measuring the azobilirubin chromophores at two wavelengths through the transparent support. The reflectance measurement at 460nm corrects for spectral interferences. The measuring range of this method is 0.1 to 27mg/dl in serum.

Delta bilirubin and bilirubin unconjugate + conjugate (Bu Bc)

We have used Vitros 250 system (Ortho-Clinical Diagnostics, Johnson & Johnson, Buckinghamshire, United Kingdom) dry slides to measure total bilirubin (TBil) and, bilirubin unconjugate + conjugate (BuBc) slides to measure delta bilirubin fraction that bounds covalently with albumin. Finally, we have derived the amount of delta bilirubin by using following formula.
[TBil- (Bu+Bc) = delta bilirubin]
Bu + Bc present in the sample was determined by end point photometric assay by using dual wavelength (400 and 460nm) at 37 °C in Vitros 250 system. The measuring range of Bu and Bc is 0.0 to 27.0mg/dl in serum.

Albumin

Serum albumin was measured by Vitros 250 system by reflectance photometry. Albumin present in the sample binds with bromcresol green (BCG) dye present in the reagent slide layer. This binding result in a shift in wavelength of the reflectance maximum of the free dye. The color complex formed was measured by reflectance spectrophotometry at 630nm wavelength. The assay was performed at 37 °C.

Gamma glutamyl transpeptidase (GGT)

Serum GGT was measured by Vitros 250 system. GGT present in the sample catalyses the transfer of the gamma-glutamyl-paranitroanilide to glycyl glycine, with simultaneous production of para- nitroaniline. The rate of change in reflection density was measured at multipoint rate by using reflectance photometry at 400nm wavelength. This rate of change in reflection density was used to calculate the GGT activity present in the sample at 37 °C. The measuring range of the assay was 10 to 1400U/L.

Statistical analysis

All variables were expressed as Mean ± SD (Standard deviation). The Mean obtain from different sample groups were compared by non-parametric Mann-Whitney U ‘t’ - test. Mean obtained from two normally distributed sample group were compared by Student’s unpaired two tailed ‘t’ test. Nonparametric multiple correlations were performed to find out the relation between delta bilirubin and rest of the variables enrolled in the present study. To find out the correlation between two variables, Spearman nonparametric correlation coefficient was used. A value of p < 0.05 was considered as statistically significant. A correlation coefficient (r) value between (-1.0 to -0.5 or 1.0 to 0.5), (-0.5 to -0.3 or 0.3 to 0.5), (-0.3 to -0.1 or 0.1 to 0.3) and (-0.1 to 0.1) were considered as robust, moderate, weak and none, respectively. All statistical analysis was performed by using Graph Pad prism software (version 5, 2007, Sandiego, California, USA).

Results

There was no significant statistical difference was found in age, sex distribution, systolic and diastolic blood pressure among all the enrolled study subjects (p > 0.05) (Table 1). A significant elevation of serum delta bilirubin was found among the subjects with chronic obstructive jaundice (0.13 ± 0.18 vs 1.66 ± 1.68; p= 0.0001), Hepatic jaundice (0.13 ± 0.18 vs 1.0 ± 0.99; p=0.0001) and the patients those who have haemolytic jaundice (0.13 ± 0.18 vs 1.11 ± 1.39; p=0.0001) compared to control individuals. Further, the subjects with chronic obstructive jaundice, showed significantly elevated delta bilirubin level even compared to the individuals having hepatic (p=0.0347) or haemolytic jaundice (p=0.0394). Whereas, no significant difference was noted in serum delta bilirubin level in between the individuals with hepatic or haemolytic jaundice (p=0.4977) (Figure 1A). Percentage of delta bilirubin was found remarkably high among the subjects with chronic obstructive jaundice (p=0.0001) and hepatic jaundice (p=0.0002) compared to control group, though no significant change was noted in between control and the subjects those who have been enrolled as haemolytic group in the present study (p=0.412). Moreover, delta bilirubin % was found strikingly high among the subjects with chronic obstructive (p=0.0006) and hepatic jaundice (p=0.047) even compared to the individuals having haemolytic jaundice (Figure 1B). A remarkable increase in serum bilirubin was found among chronic obstructive jaundice (0.65 ± 0.35 vs 5.23 ± 5.9; p=0.0001), hepatic jaundice (0.65 ± 0.35 vs 3.69 ± 3.4; p=0.0001), and haemolytic jaundice (0.65 ± 0.35 vs 3.98 ± 3.14; p= 0.0001) patients compared to control individuals. Further, an elevated trend of serum bilirubin was noticed among the subjects with chronic obstructive jaundice compared to hepatic (p=0.1961) or haemolytic group (p=0.7616) but the difference was not significant (Figure 1C).

Figure 1:Bar column of figure 1 A, B and C indicates mean (standard error) of serum delta bilirubin, delta bilirubin % and total bilirubin level among all the enrolled study subjects respectively.
A significantly elevated serum delta bilirubin was found among the subjects with chronic obstructive jaundice, hepatic jaundice and haemolytic jaundice group compared to control individuals. Subjects with chronic obstructive jaundice have showed significantly elevated delta bilirubin level compared to the individuals having hepatic or haemolytic jaundice. Percentage (%) of delta bilirubin was found remarkably high among the subjects with chronic obstructive jaundice and hepatic jaundice compared to control group, but no significant change was noted in between control and haemolytic group. Delta bilirubin % was found strikingly high among the subjects with chronic obstructive and hepatic jaundice compared to haemolytic jaundice group. A remarkable increase in serum bilirubin was found among chronic obstructive jaundice, hepatic jaundice and haemolytic jaundice patients compared to control individuals. Further, an elevated trend of serum bilirubin was noticed among the subjects with chronic obstructive jaundice compared to hepatic or haemolytic group, but the difference was not significant.

Table 1: Clinical characteristics of healthy control, Obstructive jaundice, hepatic jaundice and haemolytic jaundice subjects: Table indicates the comparison of different groups enrolled in the present study shows no statistically significant difference for sex distribution, age, and Blood pressure (BP). p<0.05 was considered as minimum level of significance. N indicates sample size.


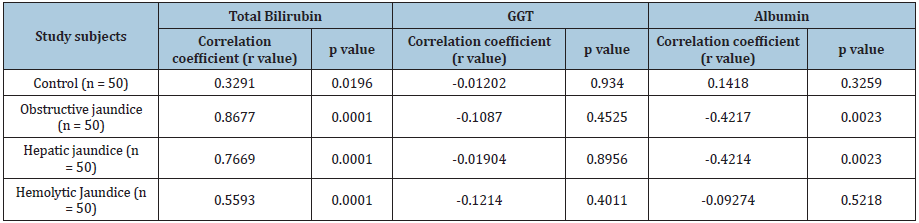
A noticeable decrease in serum albumin was noted among chronic obstructive jaundice compared to the patients having hepatic jaundice (2.85 ± 0.73 vs 3.24 ± 0.87; p=0.0177) and control individuals (2.85 ± 0.73 vs 3.94 ± 0.54; p=0.0001). Further, a significant decrease was also noted among the subjects with hepatic (3.24 ± 0.87 vs 3.94 ± 0.54; p=0.0001) and haemolytic jaundice (3.19 ± 0.85 vs 3.94 ± 0.54; p=0.0001) compared to the control group. But no significant difference was noted in serum albumin level in between the individuals with hepatic and haemolytic jaundice (p=0.7669) (Figure 2A). A significant exceptionally high GGT was found in chronic obstructive jaundice group compared to the patients having hepatic jaundice (149.4 ± 181.2 vs 636.5 ± 603.9; p=0.0001), haemolytic jaundice (24.3 ± 9.7 vs 636.5 ± 603.9; p = 0.0001) and control individuals (636.5 ± 603.9 vs 30.4 ± 19.7; p=0.0001). Moreover, the level was found elevated in hepatic jaundice subjects compared to haemolytic (p=0.0001) or control group (p=0.0001). No significant difference was noted in between haemolytic or control group (p=0.3848) (Figure 2B). Serum delta bilirubin was found in a robust significant correlation with serum total bilirubin in obstructive jaundice (r=0.8677, p=0.0001) or hepatic (r=0.7669, p=0.0001) or haemolytic jaundice (r=0.5593, p= 0.0001) group. Even more, a noticeable moderate correlation was also noted in between delta and total bilirubin among control group (r=0.3291, p=0.0196). We couldn’t find any significant relation in between elevated GGT level and delta bilirubin level among all the enrolled study subjects. Whereas, decreased serum albumin was found in a significant inverse correlation with elevated delta bilirubin level among the subjects with obstructive (r= -0.4217, p=0.0023) and hepatic jaundice (r=-0.4214, p=0.0023). However, no significant relation has been observed in between serum albumin or delta bilirubin among control (r= 0.1418, p=0.3259) or haemolytic jaundice group (r=-0.09274, p=0.5218) (Table 2).

Figure 2:Box and Whisker plot of figure 2 represents mean (+ sign), median, upper median, lower median and minimum to maximum data range of serum albumin among all the enrolled study subjects.
Significantly decreased serum albumin was noted among chronic obstructive jaundice patients compared to the individuals having hepatic jaundice and control subjects. Serum albumin was decreased significantly among the subjects with hepatic and haemolytic jaundice compared to the control group. Aligned dot plot of figure 2B represent median with range of serum GGT activity among all the study subjects. A remarkable high GGT activity was found in chronic obstructive jaundice group compared to the patients having hepatic jaundice, haemolytic jaundice and control individuals. Moreover, the level was found elevated in hepatic jaundice subjects compared to haemolytic or control group. No significant difference was noted in between haemolytic or control group.

Table 2: Table indicates the value of correlation coefficient (r) obtained from the multiple correlation study in between serum delta bilirubin and three biochemical parameters, i.e. serum total bilirubin or GGT or serum albumin among different study group.

N indicates sample size.
p<0.05 was considered as minimum level of significance.


Discussion

Elevated total bilirubin along with unconjugated hyperbilirubinemia may results from a derangement of bilirubin conjugation in the hepatocyte. Extreme heme metabolism, as a result of haemolysis or reabsorption of a large hematoma increases significant unconjugated bilirubin level in haemolytic jaundice. Pattern of haemolytic jaundice depends on abnormal red blood cell life span and may occur because of red cell membrane or enzyme abnormalities. Autoimmune disorders, drugs, and hemoglobinopathies are also considered as important etiologies of haemolysis [15,16]. The predominant causes of conjugated and unconjugated hyperbilirubinemia along with elevated total bilirubin are intrahepatic cholestasis and extrahepatic obstruction of the biliary tract. Indeed, viral infection, chronic alcoholism, different autoimmune disorders are considered as principle causal factor for the occurrence of hepatic jaundice. In contrast, obstructive jaundice manifested by hyper bilirubinemia along with elevated total bilirubin level may be due to intrinsic or extrinsic obstruction of hepatobiliary duct system and that in turn leads to cholecystitis, or inflammation of the gallbladder [5,6,17,18]. In the present study significantly increased serum total bilirubin was found in chronic obstructive jaundice patients compared to the individuals those who have hepatic or haemolytic jaundice, which was in accord with pervious findings. Further, the subjects with chronic obstructive jaundice, showed significantly elevated delta bilirubin level compared to the individuals having hepatic or haemolytic jaundice, whereas the delta bilirubin % was found significantly high among chronic obstructive and hepatic jaundice patients even compared to the individuals having haemolytic jaundice. Kozaki et al [10] reported that increase percentage of serum delta-bilirubin might indicate an effective biliary drainage and assessment of serum delta-bilirubin helps to distinguish the good drainage patients from the poor drainage patients. Another study has also reported that the concentration and proportion of total and delta-bilirubin in serum reflect the duration of jaundice and helps to evaluate the efficacy of biliary drainage. Further, it has also been reported that longer duration of cholestasis results in increased delta bilirubin level among the infants with biliary atresia [12,19]. Although, we found a significant correlation between elevated level of delta bilirubin and total bilirubin among all the enrolled patient group, but the strongest correlation was noted among the subjects those who have obstructive jaundice. So, based on earlier substantial study reports and our present findings it may be said that elevated delta bilirubin might have an intimate association with elevated serum total bilirubin in certain post hepatic inflammation or in an obstruction state. Hence, measurement of elevated delta bilirubin along with total bilirubin may provide us with a prospective tool for assessing effective biliary drainage along with duration or chronicity of jaundice, which already has been found among the subjects with obstructive jaundice. Thus, elevated delta bilirubin percentage may help to differentiate the diagnosis of obstructive jaundice from hepatic or haemolytic jaundice. Serum albumin, synthesized in rough endoplasmic reticulum of healthy hepatocytes, closely reflects an effective hepatocellular function. A low level of serum albumin concentration is a late finding in liver disease and suggests the possibility of a chronic liver disease [20]. However, decreased serum albumin was detected in hepatocellular jaundice, which was found to be associated with decreased hepatocyte function due to hepatocyte necrosis in a case of viral hepatitis. Earlier studies found normal serum albumin concentrations among the patients with biliary obstruction or acute hepatitis, and that may be due to prolong half-life of albumin in plasma [around 20 days] [21,22]. In contrast, Younes et al. [23] observed hypoalbuminemia among experimental rat model of obstructive jaundice, after two weeks of bile duct obstruction and subsequent biliary decompression. Another study also reported a significantly decreased serum albumin level among the individuals with hepatic and obstructive jaundice [24]. In the present study, low level of serum albumin was detected among all the enrolled study groups compared to control, but the subjects with obstructive jaundice has shown significantly decreased value of albumin even compared to hepatic or haemolytic jaundice group. Moreover, decreased serum albumin was found in a significant inverse correlation with elevated delta bilirubin level among the subjects with obstructive and hepatic jaundice. Low serum albumin level along with elevated serum delta bilirubin might indicate the chronicity of liver disease whether it is due to hepatic or obstructive origin. Decreased hepatocellular function among the subjects with obstructive jaundice, showed by showing lower serum albumin level, may further aggravated by persistent hepatobiliary obstructions. However, decreased serum albumin among the subjects with hepatic jaundice is consistent with earlier findings, but based on our study design certainly we are not able to explore the underlying mechanism involved in low serum albumin in haemolytic jaundice. Primary and secondary hepatobiliary disorders are considered as predominant factor associated with increased serum GGT activity. A moderate range of elevation is generally found in diffuse hepatic cell injury due to toxic or infectious hepatitis. In contrasts, higher level of GGT activity has been reported in cholestasis due to chronic intrahepatic or extrahepatic biliary obstruction. Earlier studies have documented an earlier increase of GGT in cholestatic disorders, and the elevated level persists in serum longer than alkaline phosphates. In acute viral hepatitis the levels of GGT may reach highest peak in the second or third week of illness and in some cases, they remain elevated for 6 weeks [14,25-28]. In our present study, significant elevation of serum GGT activity was found among the subjects with obstructive and hepatic jaundice compared to haemolytic or control individual. But we couldn’t find any significant correlation in between elevated GGT level and delta bilirubin level among all the enrolled study subjects. However, our findings are consistent with previous reports and further support the fact that chronic hepatobiliary obstructions might be the major precipitating factor associated with increased GGT activity in serum.

Conclusion

In conclusion, it may be hypothesized that elevated delta bilirubin, GGT activity along with lower serum albumin, and significant inverse relationship between delta bilirubin and albumin level might be the key findings associated with the occurrence of obstructive and hepatic jaundice. These findings closely indicate that the chronicity of the disease might be the predominant factor in hepatobilliary obstruction or hepato cellular injury that may worsen the pathology of obstructive or hepatic jaundice. However, further studies in a larger cohort of patients are needed to establish these findings as potential tool for differential diagnosis of obstructive, hepatic or haemolytic jaundice.

Acknowledgement

Authors profoundly thank Mr. Ravi Sinha, Zonal Sales Manager, Ortho clinical Diagnostics for his enthusiastic support and helpful suggestions.
Authors profoundly thank Mr. Rajib Banerjee and Mr. Sugata Misra for their technical support and helpful suggestions.

References

  1. Green RM, Flamm S (2002) AGA technical review of evaluation of liver chemistry tests. Gastroenterology 123(4): 1367-1384.
  2. Roche SP, Kobos R (2004) Jaundice in the adult patient. Am Fam Physician 69(2): 299-304.
  3. Dufour DR, Lott JA, Nolte FS (2000) Diagnosis and monitoring of hepatic injury i Performance characteristics of laboratory tests. Clin Chem 46(12): 2027-2049.
  4. Aithal GP, Rawlins MD, Day CP (2000) Clinical diagnostic scale: a useful tool in the evaluation of suspected hepatotoxic adverse drug reactions. J Hepatol 33(6): 949-952.
  5. Dufour DR, Lott JA, Nolte FS (2000) Diagnosis and monitoring of hepatic injury II. recommendations for use of laboratory tests in screening, diagnosis, and monitoring. Clin Chem 46(12): 2050-2068.
  6. Berk PD, Noyer C (1994) Clinical chemistry and physiology of bilirubin. Semin Liver Dis 14(4): 346-355.
  7. Seidman DS, Paz I, Stevenson DK (1991) Neonatal hyperbilirubinemia and physical and cognitive performance at 17 years of age. Pediatrics 88: 828-833.
  8. Rosalki SB, Tarlow D, Rau D (1971) Plasma gamma-glutamyl transpeptidase elevation in patients receiving enzyme-inducing drugs. Lancet 2(7720): 376-377.
  9. McCullough AJ (2002) Update on nonalcoholic fatty liver disease. J Clin Gastroenterol 34(3): 255-262.
  10. Kozaki N, Shimizu S, Higashijima H (1998) Significance of serum delta-bilirubin in patients with obstructive jaundice. J Surg Res 79(1): 61-65.
  11. Harpavat S, Finegold MJ, Karpen SJ (2011) Patients with biliary atresia have elevated direct/conjugated bilirubin levels shortly after birth. Pediatrics 128(6): e1428-e1433.
  12. Wen Y, Philip R, John CM (2015) Factors Determining delta-bilirubin levels in biliary atresia infants running head: delta-bilirubin in biliary atresia. J Pediatr Gastroenterol Nutr 60(5): 659-663.
  13. Bonnand AM, Heathcote EJ, Lindor KD (1999) Clinical significance of serum bilirubin levels under ursodeoxycholic acid therapy in patients with primary biliary cirrhosis. Hepatology 29(1): 34-43.
  14. Thapa BR (2007) Liver function test and their interpretation. Indian J Pediatr 74 (7): 663-671.
  15. Pashankar D, Schreiber RA (2001) Jaundice in older children and adolescents. Pediatr Rev 22(7): 219-226.
  16. Sackey K (1999) Hemolytic anemia. Pediatr Rev 20: 152-158.
  17. Schramm C, Kanzler S, Zum BKH (2001) Autoimmune hepatitis in the elderly. Am J Gastroenterol 96(5): 1587-1591.
  18. Kalloo AN, Kantsevoy SV (2001) Gallstones and biliary disease. Prim Care 28(3): 591-606.
  19. Higashijima H, Yamashita H, Makino I (1996) Significance of serum delta bilirubin during obstructive jaundice in dogs. J Surg Res 66(2): 119-124.
  20. Feld JJ, Heathcote EJ (2003) Epidemiology of autoimmune liver disease. J Gastroenterol Hepatol 18(10): 1118-1128.
  21. Doumas BT, Peters T (1997) Serum and urine albumin: A progress report on their measurement and clinical significance. Clin Chim Acta 258(1): 3-20.
  22. Dufour DR, Lott JA, Nolte FS (2000) Diagnosis and monitoring of hepatic injury II recommendations for use of laboratory tests in screening, diagnosis, and monitoring. Clin Chem 46(12): 2050-2068.
  23. Younes RN, Vydelingum NA, Derooij P (1991) Metabolic alterations in obstructive jaundice: effect of duration of jaundice and bile-duct decompression. HPB Surgery 5(1): 35-48.
  24. Sunanda V, Ramesh M, Sangeeta S (2012) Study of biochemical markers in jaundice: our experience. Int J Biol Med Res 3(1): 1365-1368.
  25. Giannini E, Botta F, Fasoli A (2001) Increased levels of gamma GT suggest the presence of bile duct lesions in patients with chronic hepatitis C: absence of influence of HCV genotype, HCV-RNA serum levels, and HGV infection on this histological damage. Dig Dis Sci 46(3): 524-529.
  26. McCullough AJ (2002) Update on nonalcoholic fatty liver disease. J Clin Gastroenterol 34(3): 255-262.
  27. Maggiore G, Bernard O, Hadchouel M (1991) Diagnostic value of serum gamma-glutamyl transpeptidase activity in liver diseases in children. J Pediatr Gastroenterol Nutr 12: 21-26.
  28. Jansen PLM, Muller M (2000) The molecular genetics of familial intrahepatic cholestasis. Gut 47(1): 1-5.

Crimson Publishers: https://crimsonpublishers.com/

For more articles in Journal of Medical Pathology
Please click on below link: https://crimsonpublishers.com/dcmp/

Tuesday, November 2, 2021

The Comparative Study of the Sway of Effect Pulse Energies of Pathways on AHSS-DP 350/600 and Simulation_Crimson Publishers

 The Comparative Study of the Sway of Effect Pulse Energies of Pathways on AHSS-DP 350/600 and Simulation by Baidoo Philip in Determinations in Nanomedicine & Nanotechnology_Journal of Nanotechnology

Abstract

Fatigue crack growth test was executed to determine fatigue behavior in the metallic plates of AHSSDP350/ 600. However, this new material is widely used these days in medical instruments and automobile manufacturing industries, henceforth controlling fatigue character is a major challenge in the production unit. The influence of laser shock peening with multiple choice of pulse energies on AHSSDP350/ 600 was investigated comparatively with simulation. The research work done of LSP 3D hitches of industrialized of a 3D non-lined model of Finite Element Model (FEM) grounded in the ABAQUS/ Explicit software improvement of material properties was the ultimate objective. Measuring compared of both residual stress and fatigue cycle behavior comparatively to simulation was performed. It resulted that the compressive residual stress can be injected into the outer layer of the specimen, with LSP pulse energy of S20J, S30J, D20J, and D30J of experimental work done on the specimens correlated well with the simulation.

Keywords: Finite element model; AHSS-DP350/600; Laser shock peening; Simulation; Pulse energy; Residual stress

Introduction

Laser Shock Processing (LSP) is accountably novel material outward layer body modification technology. It employs high power laser to inflict a well-built hit wave on material outer body layer to refine the material structure and induce residual stress beneficially into outward appearance [1], worked on the effects of LSP on Nano-hardness, elastic modulus and surface residual stress of Fe-Ni alloy and investigated. The importance of tiny-hardness and elastic modulus on Fe-Ni alloy after LSP were measured by the Nano indentation technology. The marked residual effort outward layer by XRD with sin2ψ and Scanning Electron Microscopy (SEM) observation of the microstructure before and after LSP solutions were captured. Execute resulted that outer appearance of the tiny-hardness, elastic modulus and outward residual effort in LSP region, were obviously raised to a desirable point as against non-LSP region [2], emphatically alarmed on a paper the negative side of an absorbent overlay on the residual stress field using LSP setup and the energy level were evaluated. The Residual defects spread in multiples have a character of inner depth governed by the drilling behavior. It was seen that the overspread of residual stress move the writeabout to a position changed on the outer side on the specimen. The prevention of coating the specimen surface after LSP have improved wear and contact fatigue properties of this aluminum alloy [3]. Confirmed also in the work done on tiny-indentation used to handle measuring tiny films on mechanical properties, including elastic modulus and tiny-hardness. The pithy-hardness and elastic modulus samples manufacture have a series of effects by LSP during LY2 aluminum alloy worked. The outcome of the result shown Nano-indentation techniques values increased by 58.13% and 61.74% as compared to non-LSP. LPS improved metal mechanical strength which governed fatigue property and corrosion resistance were alarmed [4]. Investigated that the advance-cycle fatigue feats in accordance with 7085-T7651 aluminum treated with a sample of LSP and anodization. The Stress-feats and fatigue-data were ignited in a high-level humidity environment which used smooth (Kt=1) specimens test at a stress ratio (R=0.1). This resulted that shocked specimens chanced-out higher significant improvement in fatigue performance.

Comparatively traditional processed techniques can directly handle the treatment location and its deeper depth [5]. During their work on “Surface pre-stressing to step up fatigue strength of components by LSP”. It’s a competitive technique which provides multiple robust governed fatigue [6]. made this statement that to charmed fatigue improvement on structure material, LSP must use the effects of residual stress on fatigue behavior. The crack propagation of LSP worked hole marvelously good during this investigation. The changed location microstructure of 7050 aluminum at different intensities shown that LSP had an obvious inhibitory action to crack initiation and growth respect to fatigue. These investigations have verified that LSP attempted to minimize the condemned Fatigue Crack Paths (FCP). However, the researches focused on a comparative study on different pulse energy levels of AHSS-DP 350/600 peak outrage influence concernment on fatigue. In order to satisfied this requirement, a dog bone specimens non- LSP and LSP of different energies of 20J and 30J on a single-sided LSP impact and single double sides LSP impact named: (S20J; S30J; D20J; and D30J) and non-LSP impact were done on specimens before the following tests: hardness, roughness, residual stress, fatigue cycle, and microstructure morphologies.

This resulted clear and reported in [7], Philip Baidoo (2019) resulted that Residual stress analysis of LSP can be seen that the induced outward layer peak compressive residual stresses are increased by 3 times in D20J and 2 times in D30J when the LSP paths increased from 1 to 2 to 3 in both paths. It indicated that shocking pulse of square sharp edge introduced tiny cracks on the outward layer which the wave’s inner compressive residual stress vice versa with enclosure significantly stepped up with enlargement of LSP coverage area. The Quality of the specimen’s surface treatment of different energies of LSP was all improved. However, the highest fatigue cycle life before fractured among the specimens was D30J as compared to NOLSP respectively. It was significantly indicated that clearer differences of 16289 seconds before failure as compared to without LSP respectfully. The fatigue roughness of striation of the specimens of different energies with and without LSP revealed that the higher the energy levels the higher roughness and the lower the energy level the lower the smoothness of the surface of the specimens. From the AHSS-DP350/600 specimens with different energies, there was collectively changed of fatigue crack initiation outward layer and the fatigue striation spacing with LSP. However, it’s an alarming fact that the totality of all the experiments and its observations done on LSP specimens in this paper on AHSSDP350/ 600 had a great influence as compared to without LSP significantly. However, the researcher intended again to do research in the comparative study of the influence of impact pulse energies of LSP pathways on AHSS-DP 350/600 and numerical model (simulation).

Description of the numerical model

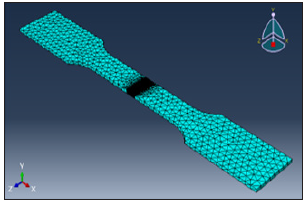
For the research work of LSP 3D hitches, therefore, the industrialized of a 3D non-lined model of Finite Element Model (FEM) grounded in the ABAQUS/Explicit software [8]. It deciphers the shock wave broadcast problematic into the solid substantial, through precise deliberation of its elastic-plastic comportments. From the opinion of interpretation of period alterations, the customary approach of unambiguous differencing for the preliminary reckless shock proliferation phase trailed by average unspoken differencing for the investigation of the concluding Compressive Residual Stress (CRS) symmetry is not hand-medown, in its place only clear differencing has stayed second-hand with long-time progresses in direction to scope stress equilibration. From the geometrical argument of understanding, a bursting 3D conformation for the factual geometry and for the successive touching approach double of throbs has been well-thought-out. The FEM elements castoff are eight-node bricks (namely C3D8R) with abridged incorporation and hourglass regulator in the preserved area and a six-node trilinear prism (namely C3D6) in the respite of the geometry, wherever there is no functional load, construction easier to mesh multifaceted geometries (Figure 1).

Figure 1: Optimized mesh.


The element scope, in the preserved zone, permits upholding cunning junction and whose charge has remained intended by a directed merging examination through the model itself. An entire of 645,736 rudiments are rummage-sale in the complete network. As a consequence, the industrialized FEM model has the chief benefit of permitting the reproduction of LSP dispensation in actual geometries considering an enormous quantity of pulses terminated hefty zones, fetching a hike in superiority with deference to the maximum pertinent FEM models designated in literature, counting the following: Where Brockman et al. [9], industrialized a dependable investigation model to comprehend the multifaceted three-dimensional stress waves and envisage CRS [10], where Warren et al. simulated LSP seeing high pulse touching in a minor expanse where Faiedh HN et al. [11], developed a FEM model to calculate depression distortion produced by solitary LSP pulses and schoolwork the inspiration of proportion intersection and radioactivity approaches in CRS in an imperfect volume and where Ren et al. [12], simulated the thermal reduction of CRS in a simplified geometry.

Result and Discussion

FEM simulation

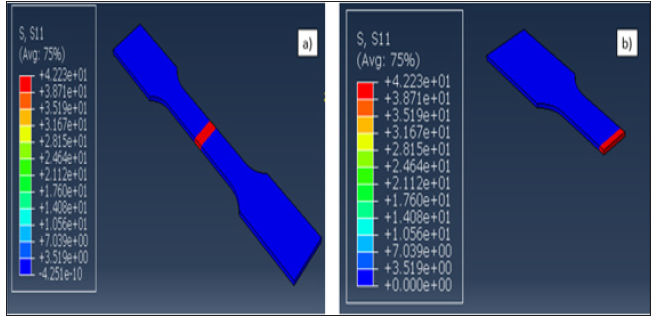
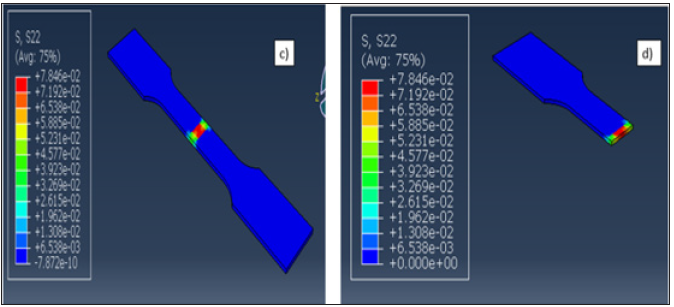
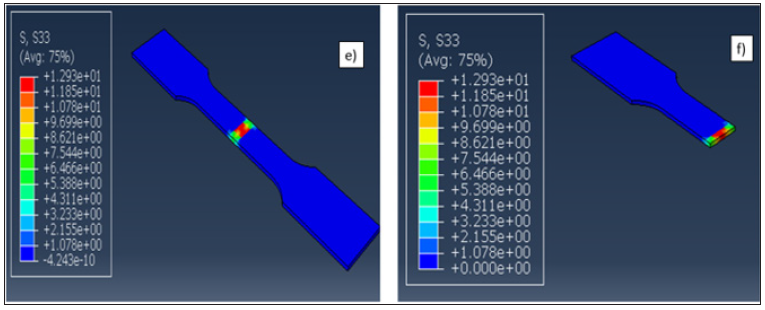
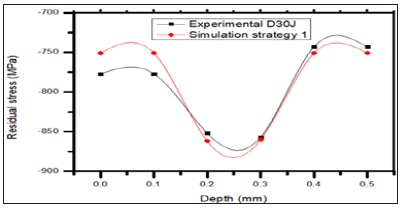
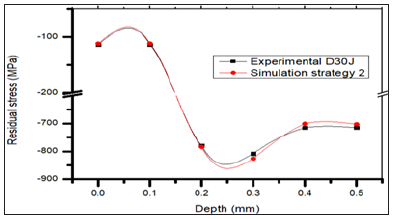
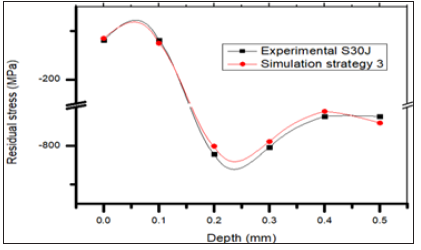
Simulations have shown that the residual stresses distribution in AHSS-DP 30/600 does not only depends on conventional LSP parameters and the induced residual stress dependency on the pulse sequence has been revealed specimens during fatigue testing of different energy levels of LSP. The strategy 1, 2 and 3 in Figure 2-4 are simulation parts of the experimental work of D20J, D30J and S30J specimens respectively. Its advancing direction of the treatment is parallel to the fatigue load. In order to perform the double-sided LSP, firstly the upper surface is peened and right after the bottom surface is peened. Figure 2-4 shows the simulation results after applied strategies. It can be seen that the induced residual stresses in the whole specimens, with views of both the upper and bottom surfaces and the cross-section respectively.

Figure 2: Residual stresses simulation results after strategy 1.


Figure 3: Residual stresses simulation results after strategy 2.


Figure 4: Residual stresses simulation results after strategy 3.


The residual stresses analysis indicates that the stress distribution presents a sandwich-type distribution in depths, with compressive stresses under the treated surfaces and tensile stresses between them (due to the self-equilibration stress in the material). From Figure 5-7, this induced tension in the mid-thickness could be problematic in case of its magnitude achieves moderate-high values, after strategy 1, 2 and 3 revealed. FEM results also show that the residual stress distribution is not exactly symmetric in depth, with noticeable differences between the residual stress magnitudes achieved in the surfaces, presenting more CRS in the upper surface than in the bottom surface. This difference is definitely related to the fact that both the upper surface and the bottom surface are not simultaneously peened (realistic experimental conditions are simulated). When LSP is applied to the bottom surface, the material has been pre-stressed already despite that the strategies 1, 2 and 3 are correlating well with the experiments.

Figure 5: Optimized mesh.


Figure 6: Optimized mesh.


Figure 7: Optimized mesh.


Conclusion

Residual stress analysis of LSP can be seen that the induced outward layer peak compressive residual stresses are increased by 3 times in D20J and 2 times in D30J when the LSP paths increased from 1 to 2 to 3 in both paths. It indicated that shocking pulse of square sharp edge introduced tiny cracks on the outward layer which the wave’s inner compressive residual stress vice versa with enclosure significantly stepped up with enlargement of LSP coverage area. However, the simulation result correlated well to the experimental result.

References

  1. Cheng GG, Feng AX, Jiang YF, Lu JZ, Zhang L (2009) Effects of laser shock processing on mechanical properties of Fe-Ni alloy. Mater Des 30(9): 3673-3678.
  2. Banderas A, Gomez R, Molpeceres G, Ocaña C, Porro JL, et al. (2006) Effect of an absorbent overlay on the residual stress field induced by laser shock processing on aluminum samples. Appl Surf Sci 252(18): 6201-6205.
  3. Guan HB, Lu JZ, Luo KY, Qian XM, Zhang LF, et al. (2010) The microstructure mechanism for mechanical property of LY2 aluminum alloy after laser shock processing. Mater Des 31(5): 2599-2603.
  4. Hill MR, Luong H (2008) The effects of laser peening on high-cycle fatigue in 7085-T7651 aluminum alloy. Mater Sci Eng A 477(1-2): 208-216.
  5. Harris F, Hammersley G, Hackel LA (2000) Surface prestresing to improve fatigue strength of components by laser shot peening. Opt Lasers Eng 34(4-6): 327-337.
  6. Dai FZ, Ren XD, Ruan L, Sun GF, Yang HM, et al. (2013) The effects of residual stress on fatigue behavior and crack propagation from laser shock processing-worked hole. Mater Des 44: 149-154.
  7. Baidoo P (2019) The sway of effect pulse energies of pathways on AHSS-DP 350/600. Res Dev Material Sci 12(3).
  8. (2014) ABAQUS user’s manual. 6(13).
  9. Brockman R, Braisted W, Olson S, Tenaglia R, Clauer AH, et al. (2012) Prediction and characterization of residual stresses from laser shock peening. Int J Fatigue 36(1): 96-108.
  10. Warren AW, Guo YB, Chen SC (2008) Massive parallel laser shock peening: Simulation, analysis, and validation. Int J Fatigue 30(1): 188-197.
  11. Faiedh HN, Peyre P, Song H, Popa I, Ji V, et al. (2015) Finite element analysis of laser shock peening of 2050-T8 aluminum alloy. Int J Fatigue 70: 480-489.
  12. Ren XD, Zhang QB, Yuan SQ, Zhou JZ, Wang Y, et al. (2014) A finite element analysis of thermal relaxation of residual stress in laser shock processing NI based alloy GH4169. Mater Des J 54: 708-711.

https://crimsonpublishers.com/dnn/fulltext/DNN.000525.php

Crimson Publishers: https://crimsonpublishers.com/

For more articles in Journal of Nanotechnology
Please click on below link: https://crimsonpublishers.com/dnn/

Monday, November 1, 2021

Using Shortened Systematic Strategic Planning (SSP) Working Model for the Development of a Strategic Plan of an Entrepreneurial Business-Case Study_Crimson Publishers

Using Shortened Systematic Strategic Planning (SSP) Working Model for the Development of a Strategic Plan of an Entrepreneurial Business-Case Study by Hakan Butuner in Integrative Journal of Conference Proceedings_Integrative Journal of Conference Proceedings

Abstract

Where strategic analysis tools are explained, this is most frequently done conceptually rather than their actual application in strategic planning. Shortened systematic strategic planning (SSP) consists of a pattern of stepwise procedure for straight-forward planning, and the fundamentals involved in any strategic planning project. SSP has been applied to and tested on different businesses’ subject issue and has been generated by the composition of the cause-and-effect relations of them. The intention here is to provide a new perspective and benefit for the strategic planners by introducing this new systematic methodology and demonstrating its implementation on an entrepreneurial and new business called Visual Co. Accordingly, let shortened version of SSP easily understood and universally applied to any small- and medium-size businesses. Additionally, you are guided how to identify in what circumstances you might use its specific tools and how to target them directly at achieving effective results. The data that are used in this case are fictitious and only help for this study. Though, the given case does not cover all the steps of a typical systematic strategic plan and use all the recommended techniques, it still reflects the basics.

Keywords: Strategic planning; Strategic management; Systematic strategic planning; Strategy; Case study in strategic planning

Introduction

Shortened systematic strategic planning (SSP)

Before beginning with strategic planning, businesses must have articulated their missions and visions, and identified their basic policies [1]. Strategic plan helps the business to establish its objectives, goals, as well as the decisions to achieve these objectives and goals. Thus, a strategic plan provides guidance for the preparation of functional plans, such as marketing, finance, production, etc., and business budget in such a manner that they reflect the objectives, goals, and main strategies of the strategic plan during the implementation phase, as well as for basing resource allocation on priorities [2]. Systematic Strategic Planning is the pattern of procedures by which an organization defines its status, opportunities, long-term goals, and the strategies for which to achieve them. SSP is based on the principles of Planning by Design (PxD) which is generated by Muther [3]. A strategic plan includes the fundamentals, and the basis on which any systematic strategic planning must rest are competitive advantages, scenarios and strategies.

Competitive advantages: Competitive advantages are fundamental A. Because of investigating internal and external factors, weaknesses and strengths of the organization determined. Based on the comparison of the strengths with market conditions, the unique strengths, that is, competitive advantages of the organization are determined.

Scenarios: Scenarios are fundamental B. Scenario analysis is made on external factors-macro economic analysis, industry analysis, etc. By this analysis, negative and positive scenarios are determined. These scenarios help to predict the industry’s future.

Strategies: Strategies are fundamental C. Strategies are the fundamental that helps the organization to define how to reach to the opportunity that is brought out by matching fundamental A with fundamental B. This fundamental characterizes the process that organization should follow to reach the opportunity and guides the organization about how it should be done. The use of shortened SSP version is more suitable for the development of strategic plans for small- and medium-size businesses (SMEs). This paper is intended to briefly explain how each step of shortened SSP pattern can be applied on a given case. The case study presented in here is an entrepreneurial and new business. The data that are used in this case are fictitious and only help for this study. Though, the given case does not cover all the steps of a typical systematic strategic plan and use all the recommended techniques, it still reflects the basics.

Systematic pattern of strategic planning

The newly generated Shortened SSP is a six-step methodology intended to identify the three fundamentals. Figure 1 illustrates shortened version of SSP.

Figure 1:Shortened systematic strategic planning.


Investigating environmental and internal conditionsclarification of current status: The aim of the first section of SSP is to answer the question, where are we? This requires a comprehensive status analysis. During and after status analysis, the internal strengths and weaknesses of the organization, and the positive and negative developments originating from the external factors are identified.

Internal Analysis

Internal status analysis begins with a brief history of the business. Therefore, the business should examine its past performance to isolate key internal contributors to favorable (or unfavorable) results. Diagnosing a business’ key strengths and weaknesses requires the adoption of a disaggregated view of the business. Examining the business across distinct functional areas (such as, overall management, human resources, operations/ technology, marketing, finance and accounting) is one way to disaggregate the business for internal analysis purposes. The purpose is to identify the potential of the business taking into consideration its existing performance and problems.

Environmental Analysis

Environmental analysis considers the general trends in the world, changes in the environment in which the business operates and particularly the expectations of the group served by the industry. Environmental analysis does not only identify status, but also lays the basis for future forecasts or creation of scenarios. While making these assessments, the global and domestic trends in the sector/sub-sector in which the organization operates are discussed.

Intention of environmental analysis:

A. To determine the developments and trends in the macroeconomical (demographic, economical, judicial-political, technological, sociocultural) environment that effects the business and its industry at most. This review should primarily be conducted at global scale, and then at regional and country scales.

B. The effects of trends and developments within these variables on the industry are analyzed with respect to customers’, governments’, financial institutions’, suppliers’, shareholders’, and employees’ points of view.

C. To understand the powers that effect competition in the industry (new businesses, customers, suppliers, substitutes, competitors, government, financial institutions, etc.) [4]. When one of these groups has a higher power, this will have negative implications for the industry, whereas a lower power will have positive implications.

D. To foresee the trends that these powers would create in the industry [5] stated that each industry passes through the phases of introductory, growth, maturity, and finally regression. The phase that the industry is in facilitates the estimation of impacts and trends of powers defined in competition analysis.

Comparison of Status and Identification of Competitive Advantages

The organization’s strengths and weaknesses are compared with the key factors in the market development phases, capacities, and resources of main competitors and the industry’s success factors, to identify competitive advantages. Figure 2 summarizes the development of a business [6]. A factor is considered a competitive advantage if it is something the business does (or has in the future capacity to do) particularly well relative to the abilities of existing or potential competitors. A firm gains competitive advantage by performing these strategically crucial factors for cheap or better than its competitors.

Figure 2:Competitive advantages and success factors.


Figure 3:Procedure of identifying opportunities.


Understand Scenarios and Define Opportunities (Figure 3). Using the trends to be revealed by the environmental analysis, it is possible to anticipate how the field of business in which we operate or plan to enter will evolve in the future. It is intended to find the factors that would affect and change the outlook mostly in the status and anticipated future, based on the results obtained from environmental analysis. Then, the scenarios to be created by trends revealed by environmental analysis for the industry must be developed; that is, alternative scenarios must be developed for the future.

Finally, to identify the business’ potential opportunities, the organization’s competitive advantages need to be matched with the potential positive (attractive) scenarios in the industry. Besides market attractiveness of each scenario, you also need to take some view of the organization’s competitive position with respect to the scenario [7].

Identification of strategic objectives and main goals and development of alternative strategies

The parameters constituting the assumed opportunities need to be laid down as strategic objectives and main goals. Strategic objectives are the conceptual results that the organization aims at achieving within a certain timeframe. Strategic objectives and main goals answer the question what do we want to achieve?

Main goals are specific and measurable sub objectives specified for achievement of strategic objectives. Main goals can be classified as financial and market goals, such as target markets, product range, sales volume and profitability for the planned period, regional concentration, etc.; and operational goals, such as organization, investment goals, labor turnover rate, environmental standards, technology and equipment choice, quality and performance standards, long-term capacity plans, etc.

It is necessary to analyze what should be done and how should they be done to attain opportunities and thus achieve goals, as well as to identify alternative strategies. Determination of a suitable strategy for a business begins in identifying the opportunities and risks in its environment. While evaluating the opportunities defined based on analyses conducted, various strategies we can implement come out [8]:

A. You should have a single strategy for a single opportunity.

B. If there are multiple opportunities, you can have multiple strategies.

Based on using both the techniques of Generic Competitive Strategies [4] and Components of Strategy [9], the corresponding Grand Strategies can be identified [6]. For example; concentration, market development, product development, innovation, horizontal integration, vertical integration, joint venture, concentric diversification, etc.

Evaluating strategic plans and selecting the best

Here you select the strategic plan most suitable for your organization. To do this, you make an evaluation of the alternatives based on qualitative factors [3]. For example; synergy, competitive advantages, flexible organization structure, market orientation, critical success factors, etc. Even if the best strategy is selected, contingency plans are still necessary for the selected strategy in a risky environment. A sensitivity analysis needs to be conducted [10], taking into consideration the possibility that basic assumptions and parameters do not come out as expected and the measures considered to be taken in this respect need to be identified.

Implementation plan and control

The implementation plan is a tool that gets strategic plans underway. The implementation plan required to be created to answer the question how can we reach our target destination? in the systematic of strategic planning must be coherent with the whole of strategic plan [11]. This is the step when action plans are prepared to identify by whom, how, and when the strategy created to achieve strategic objective and goals will be implemented within the business. This step also involves the preparation of budgets for utilization of resources required for the realization of action plans.

Visual Co

Visual Co. has a vision that is to become a totally respected regional company for those looking for a breathing space and/ or trying to carry themselves to a better mood by capturing and influencing the imaginations. Its mission is to be a continual challenger against the leaders of the entertainment industry and make the consumers’ moods better by sensorial joy assets [12].

Clarification of Current Status

Internal analysis: Functional approach is used for internal analysis which is shown in Table 1. In the table,

A. The strengths are marked as (+)

B. The weaknesses are marked as (-) (Table 1)

Table 1:Functional approach worksheet.


Environmental Analysis

Macroeconomic analysis

Table 2:Macroeconomic analysis form.


Table 2 shows the macroeconomic analysis form that summarizes the status of the variables with respect to customers’, government’s’, financial institutions’, suppliers’, shareholders’ and employees’ points of view. If the macroeconomic factor will

A. Turn into a better condition, then mark as +

B. Remain unchanged, then mark as blank

C. Turn into a worse condition, then mark as –

Customers’ point of view

A. Demographic and technological factors will change in a better way.

B. Economic factors, except unemployment rate and saving/ consuming trends, will be worse.

C. Gross domestic product (GDP) will be stable.

D. Legal and political factors, except tax laws, will be better, and there will be political stability.

E. Socio and cultural factors, such as life styles and career expectancy, will be better.

F. Family structures and personal values/beliefs will remain unchanged.

Governments’ point of view

A. Demographic factors, except age pattern and immigration trends, will be better.

B. Economic factors, except interest rates, foreign exchange policy; and saving/consuming trends, will be worse.

C. GDP will remain unchanged.

D. Legal and political factors, except tax laws and technological factors, will be better.

E. There will be no change in tax laws.

F. Sociocultural factors, such as family structures and personal values/beliefs, will be worse.

G. Lifestyles will remain unchanged.

Financial institutions’ point of view

A. Demographic factors, except age pattern and education level, will be better.

B. Economic factors, except interest rates, inflation rate, and unemployment rate, will be better.

C. The foreign exchange policy and income distribution will remain unchanged.

D. Legal and political factors, except business law and technological factors, will be better.

E. There will be no change in business law.

F. All sociocultural factors will be better.

1. Suppliers’ point of view

A. Demographic factors, except age pattern, will be better.

B. Economic factors except interest rates, foreign exchange policy and saving/consuming trends will be worse.

C. GDP will remain unchanged.

D. Legal and political factors, except business and tax laws, will be better.

E. Sociocultural factors, except career expectancy, will be better.

F. Technological factors will be better.

Shareholders’ point of view

A. Demographic factors, except population growth, will be better.

B. Age pattern and immigration trends of the population will remain unchanged.

C. Economic factors, except income distribution, foreign exchange policy, and saving/consuming trends, will be worse.

D. The unemployment rate and GDP will remain unchanged.

E. Legal and political factors, except tax laws, will be better.

F. Law against monopolization and political stability will not change.

G. All technological and sociocultural factors will be better. Employees’ point of view

A. All demographic factors will be worse.

B. Economic factors, except GDP, interest rates and saving/ consuming trends, will be worse.

C. Legal and political factors, except tax laws and political stability, will be better.

D. Technological factors, except research and development expenditures, innovation opportunities, and new products, will be worse.

E. Sociocultural factors, except changes in life style, will be worse.

Competition analysis

Table 3 shows the status of the existing firms, threats of new companies, and competitive power of customers and suppliers.

Table 3:shows the status of the existing firms, threats of new companies, and competitive power of customers and suppliers.


Rivalry

A. Number of firms in the industry is few.

B. Industry growth rate is uniform.

C. Product differences and specialties are high.

D. Fixed costs of the firms are high and cost of leaving industry is reasonable.

New players

A. High-capital investment is necessary to enter the industry.

B. Hard to reach to the channels of distribution.

Customers and suppliers

A. Cost of changing suppliers is high.

B. Prices are flexible.

C. Number of suppliers is few.

Industry Life Cycle

Figure 4:Industry life cycle.


Due to its dependency on technological development, new segments of the media and entertainment industry are constantly being introduced. Entertainment and media are evolved in a highly dynamic nature. Entertainment and media industry revenues were $1.321.890 billion in 2009, and grew further to $1.356.574 billion in 2010, and it is expected to be $1.690.298 billion in 2014 globally. Internet advertising will be the fastest growing media during the next five years. Advertising will increase from $2.005 billion in 2010 to $3.148 billion in 2014 in Turkey. Entertainment and media industry are in a growth stage, as shown in (Figure 4).

Competitive advantages, success factors, weaknesses

Table 4:Comparison table.


Table 4 is a comparison table that ends-up with competitive advantages, success factors and weaknesses of the firm, defined as follows:

Competitive advantages: Factors providing the business with an edge compared to its main competitor and industry average, that is, the ones that have plus sign only on the Visual Co. column.

Success factors: Factors that are important capabilities for the business to have but are also typical of every viable competitor; do not represent a potential source of any strategic advantage.

Key vulnerabilities: Factors on which the business currently lacks the necessary skill, knowledge, or resources to compete effectively, and shown as minus sign on the Visual Co. column (Table 4).

Scenarios and opportunities

Based on the outcome of environmental analysis, the concluded positive and negative scenarios for the entertainment and media industry are summarized below. Additionally, the concluded business opportunities for Vision Co., by matching its competitive advantages with the potential positive sceanarios of the industry, are listed below as well.

Positive scenarios

Product/service mix and expansion potential: The industry is new, and yet products are highly demanded.

Product/service image, reputation and quality: Despite the intensive use of technology; a lot of work is based on creativity, so there will be many opportunities to offer quality products to the market.

Ability to raise short-term capital: Investors are willing to invest in this technology-intensive, promising, and rapidly growing industry. Cost of entry and barriers to entry is high for new players.

Negative scenarios

A. In media and especially in animation sector, because of the narrow price-range, if costs increase, they cannot be charged to the end user due to the nature of sales agreements.

B. Creation of visual products is mainly based on detailed studies, and this may decrease efficiency and increase costs.

C. Because of the creativity-based structure and high variety of products, difficulties may arise in using standard procedures and techniques.

Business opportunity

A. Easy to gain a competitive position, as potential entrepreneurs cannot enter the market due to prohibitive cost barriers.

B. Cultural richness in the region can be applied to product design and should be used as an opportunity to increase the market share.

Main strategies

Based on the determined opportunities of Vision Co., its products will always be perceived as creative and new within the existing market. Product development will be its main strategy (Table 5).

Table 5:Components of strategy.


Developing new product features:

Adapt: Know-how will be brought through strategic alliances and will be adapted to the organization. Being a pioneer in the market will be an advantage for substantial product development.

Modify: The technology and theme (characters, soundtracks, etc.) used will be updated according to the market requirements and changing preferences of customers.

Minify: iPhone applications will be created for its trailers integrated with social media.

Substitute: Its products will be applied to the toys of movies, such as animal characters, etc.

Combine: Selling specially designed (logos, themes, shapes) 3D eyeglasses to movie audiences.

Vision Co. will also focus on differentiation as a strategy, as shown in Table 6, by using its differentiation as a competitive advantage on a narrow scale market.

Table 6:Generic strategies.


Conclusion

The aim of Systematic Strategic Planning (SSP) is to force a consider the future and therefore provides an opportunity to influence the future, or assume a proactive posture, to provide better awareness of needs and environment, to help define and focus on the objectives of the organization. SSP-shortened version consists of a pattern of six steps for straight forward planning, and the three fundamentals (competitive advantages, scenarios and strategies) involved in any strategic planning project. The use of shortened SSP version is more suitable for the development of strategic plans for small- and medium-size businesses. SSP has been applied to and tested on different businesses’ subject issue and has been generated by the composition of the cause-and-effect relations of them.

Here, we have provided a new perspective and benefit for the strategic planners by introducing the newly generated shortened version of SSP and demonstrating its implementation on an entrepreneurial and new business called Visual Co. This will help SSP users to easily understand and apply this new methodology to any small- and medium-size businesses’ strategic planning project. Though, the given case did not cover all the steps of a typical systematic strategic plan and use all the recommended techniques, it still reflected the basics. Some of the special working forms, in the forms of key documents and output, were used in applying the techniques in each step of the SSP pattern on the given case.

References

  1. Wickham PA (2004) Strategic entrepreneurship. Pearson Education Limited, London, UK.
  2. Harrison JS, John CH (2001) Foundations in strategic management: Evansville. South-Western Publications, Tennessee, USA.
  3. Muther R (2011) Planning by design, Institute for High Performance Planners. Kansas City, USA.
  4. Porter ME (1998) Competitive strategy: Techniques for analyzing industries and competitors. Florence: The Free Press.
  5. Vernon R (1979) The product cycle hypothesis in a new international environment. Oxford Bulletin of Economics and Statistics 41(4): 255-267.
  6. Pearce J, Robinson R (2011) Strategic management: Formulation, implementation and control. Columbus, McGraw-Hill, USA.
  7. Rasiel EM (1999) The McKinsey way. Columbus, McGraw-Hill, USA.
  8. Wright P, Parnell J, Kroll M (1997) Strategic management: Concepts. Prentice Hall, New Jersey, USA.
  9. Ansoff HI (1987) Corporate strategy (revised edn). Penguin Books, London, UK.
  10. Keown AJ, Martin J (2001) Financial management: Principles and applications. Prentice Hall, New Jersey, USA.
  11. Porter ME (2002) What is strategy? HBR on point enhanced edition. Watertown, Harvard Business School Press, USA.
  12. Porter ME (1980) Competitive strategy. The Free Press, New York, USA.

Crimson Publishers: https://crimsonpublishers.com/

The Efficacy of Sap Obtained from Commiphora gileadensis Against Cadmium-Induced Liver Toxicity in Rats: Crimson Publishers

The Efficacy of Sap Obtained from Commiphora gileadensis Against Cadmium-Induced Liver Toxicity in Rats by Amal S Soliman in Research in Med...