Crimson Publishers High Impact Journals

Monday, February 28, 2022

Application of Raman Micro Spectroscopy and Micro-FTIR Mapping in the Bio-Hydrometallurgy of Copper Sulfide-Minerals_Crimson Publishers

 Application of Raman Micro Spectroscopy and Micro-FTIR Mapping in the Bio-Hydrometallurgy of Copper Sulfide-Minerals by Constantinos Varotsis in  Aspects in Mining & Mineral Science_Mining and Mineral Science journals

Abstract

A combined application of μm-FTIR mapping and Raman microspectroscopy for the bioleaching behaviour of copper sulfide minerals such as chalcopyrite, bornite, chalcocite and covellite provides valuable information on the whole bio-hydrometallurgy Cu/Fe/S system. Both techniques provide label-free, nondestructive visualizations of the bio-hydrometallurgy dynamics for processing and storage of large spectral data sets which are valuable for evaluation of copper, iron and sulfur containing minerals. The results provide solid evidence that the techniques can be also applied to other Bio-hydrometallurgical extracted metals from Polymetallic Mineral Resources.

Keywords: Micro spectroscopy; Minerals; Metal ions; Copper

Introduction

New methods for maximizing copper extraction from whole ores and processing tails and sensory technologies for daily monitoring have been developed (Figure 1). Heap bioleaching is the most applicable technology to treat low grade copper sulfide ores and bearing chalcopyrite, idaite, bornite, chalcocite and covellite. A variety of biochemical processes in conjunction with state-of-the-art sensory technologies have been applied towards establishing the Bio- hydrometallurgy treatment of low-grade copper mixed ores and mineral processing tails [1,2]. High copper extractions are achieved with isolated and mixed cultures of the mesophilic iron and sulfur oxidizing bacteria Acidithiobacillus ferroxidans and Acidithiobacillus thiooxidans, and in the presence of moderately thermophilic microorganisms such as Acidithiobacillus caldus, Leptospirillum ferriphilum and their mixed cultures [1,2]. The elucidation of the mechanisms involved in the interactions of sulfur oxidizing bacteria with the mixed ores in the bioleaching procedure is important for understanding the bioleaching behavior between single and mixed ores and the origin of the existing differences [1,2]. Oxidation-reduction potential, temperature, pH and the origin of the microorganisms are crucial in our understanding the whole bio-hydrometallurgy system. Chalcopyrite [CuFeS2] is the most abundant copper sulfide ore that has received extensive attention because there are considerable ore reserves that could be exploited. It has been suggested that the primary oxidation product of chalcopyrite leaching is chalcocite which is subsequently oxidized to covellite [2].The formation of the latter is confirmed by ore microscopy and by a number of structure sensitive techniques such as Raman and FTIR [1,2]. Raman spectra including the images can provide the information for identification of surface species/phases and spatial variations in composition of the bioleaching of chalcopyrite as well the formation of the passivation layers in Cu/Fe/S and Cu/S systems. (Figure 2) spectrum A, shows the Raman spectra of bornite and the 1-6 months bioleached bornite samples by a consortium of microorganisms consisted of Acidithiobacillus ferrooxidans, Acidithiobacillus thiooxidans, Acidithiobacillus caldus, Leptospirillum ferriphilum, Leptospirillum ferroodiazotrophum and Sulfobacillus thermosulfidooxidans. In the one month bioleaching period (spectrum A) there are several new Raman bands including those at 220 and 430cm-1 which we assign to the ν(Fe-O) of K+- jarosite respectively. We also assign the bands at 450, 624, 1004, 1097, and 1157cm-1 to ν2(SO42-), ν4(SO42-), ν1(SO42-), ν3(SO42-) and ν3(SO4)2- of K+- jarosite, respectively. The marker band in the Raman data for distinguishing the K+ from NH4+ jarosite is the ν3(SO42-) vibration observed at 1099cm-1 in the spectra of K+- jarosite and at 1091cm-1 in the spectrum of NH4+-jarosite. The absence of NH4+ marker bands in the spectrum strongly suggests that in one month period only K+- jarosite is formed. The strong band at 473cm-1 is attributed to ν(Cu-S) of covellite. Elemental sulphur and polysulfides contain S-S linkages and display the ν(S-S) and δ(S-S-S) which are characterized by equally strong intensities at 470 at 215cm-1, respectively. The intensity of the ν(S-S)/δ(S-S-S) ratio has been applied used to distinguish the elemental sulphur from the other S-S and Cu-S bond containing species. At six months (spectrum B), the 220cm-1 band attributed to K+- jarosite has shifted to 218cm-1 and gained intensity which is attributed to the formation of δ(S-S-S) of elemental sulphur. Given that the ν(S-S) and δ(S-S-S) are characterized by equally strong intensities we suggest that the band at 473cm-1 has little contribution from the ν(Cu-S), and thus, we attributed it to ν(S-S) of elemental sulphur. This observation indicates that at six-months of bioleaching, the 474cm-1 covellite band observed in spectrum A has disappeared. In addition, all bands attributed to K+- jarosite including the ν(Fe-O) at 430cm-1 have lost most of their peak intensity, and in contrast to the bioleaching behaviour of chalcopyrite, there is no evidence for the formation of NH4+- jarosite. Studies examining the dissolution behaviour of K+- and NH4+- jarosites from the ore surface are limited. It is intriguing to propose that in our study more than one microorganism was involved in the biosynthesis of K+- jarosite. The presence of K+- jarosite at one month period and the lack of NH4+- jarosite formation suggest that K+- jarosite is not subject to microbial reduction leading to intermediate mineral of the microbial process. In addition, the behavior of the K+- jarosite marker bands at six months period indicates that either its presence is reduced substantially because it has broken down by converting to iron (III) oxide or oxyhydroxide phases or that is not part of the surface of the bioprocessed mineral, and thus, not detectable

Figure 1: Proposed sequential pathway for the bioleaching evolution of chalcopyrite that involves idaite, bornite, chalcocite and covellite [2].
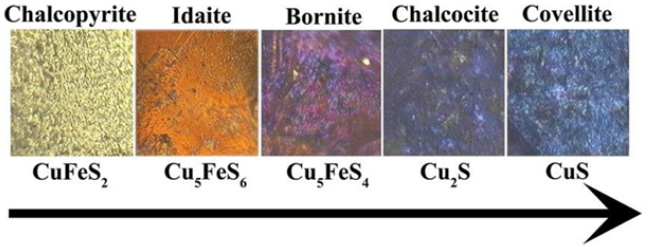

Figure 2: Raman spectra of bioleached bornite samples. The consortium of microorganisms consisted of Acidithiobacillus ferrooxidans, Acidithiobacillus ferrooxidans, Acidithiobacillus ferrooxidans, Leptospirillum ferriphilum, Leptospirillum ferroodiazotrophum and Sulfobacillus thermosulfidooxidans. Spectra A and B are at one and six months of bioleaching period, respectively.

Bioleaching of Cu/Fe/S minerals also leads to precipitation of Fe(III) hydroxysulfates and metal- deficient passivating layers which dramatically decrease the access of leaching agents and bacteria cells to the mineral surfaces, making the bioleaching procedure still not optimized and fully successful. FTIR imaging spectroscopy has been applied to monitor the formation of jarosite passivation layers which are of profound importance because despite great efforts, researchers have not reached a consensus on the control steps governing whole ore bioleaching [1,2]. Potassium Jarosite [KFe3(SO4)2(OH)6] is a mineral that is common in acidic, sulfate-rich environments, such as acid sulfate soils derived from pyrite-bearing sediments, weathering zones of sulfide ore deposits and acid mine rock drainage (ARD/AMD) sites. Jarosite typically is formed in ferric rich, acidic (pH<3) oxic environments and readily breaks down when removed from its stability region by presumably converting to iron (III) oxide or oxyhydroxide phases. K+- jarosite converts to goethite through the following reaction

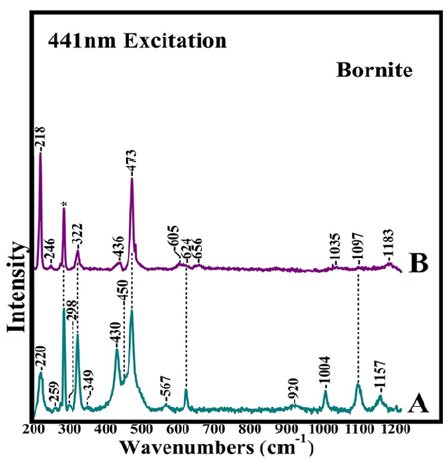
Bacterial cell finds a way to protect itself from the infiltration of toxic metal ions by covering its peripheral surface with a shield of EPS. Structural and compositional makeup of EPS favors the sequestration of metal ions and hence obstructs them from penetrating the cell surface. The mixed culture microbial biofilms and their extracellular polymeric substances associated with the solid-liquid interfaces have several key properties and functions. A close inspection of the intensity of the respective peaks in the 1000- 1200cm-1 region in the FTIR spectra illustrated that the relative contents of chemical groups are distinctly different between bornite, chalcocite and covellite [1,2]. The mixed culture biofilms are spatially structured communities of microbes whose function is dependent upon a complex web of symbiotic interactions. Apart from cellular constituents, a major component of biofilm systems is the EPS produced by the members. The extracellular polymeric substances (EPS) of the biofilm matrix appear to have several key properties and functions. Extracellular polymeric substances (EPS) are complex high molecular weight microbial biopolymers which occur in a range of molecular sizes, conformations and physicochemical properties, and polysaccharides, proteins, lipids, and even nucleic acids are actively secreted components. The physical ultrastructure of how individual EPS interact with each other is poorly understood. The major components present in EPS are proteins, polysaccharides, uronic acids, lipids and humic substances. Little is known about the mineral-humic substances interactions. One of its essential constituent is the exopolysaccharide (EPS) released out of self defence against harsh conditions of starvation, pH and temperature, hence it displays physiological, rheological and physico-chemical properties (Figure 3).

Figure 3: Collective image of the surface of bioleached covellite and the FTIR spectra collected from the surface of the mineral at seven week period time. The consortium of microorganisms consisted of Acidithiobacillus ferrooxidans, Acidithiobacillus thiooxidans, Acidithiobacillus caldus, Leptospirillum ferriphilum, Leptospirillum ferroodiazotrophum and Sulfobacillus thermosulfidooxidans. Each spectrum represents the infrared fingerprint of an area of 0.01mm2 of the mineral surface with spectral resolution 4cm-1.

The FTIR analysis was carried out to probe the chemical structures of the various mixed culture biofilms and their EPS on the surfaces of covellite. The positions and number of FTIR peaks for the different biofilms and EPS appeared to be quite different, implying that the types of chemical groups involved are quite different. Several strong bands associated with proteins and polysaccharides were observed in the marker bands, among which are the stretching vibration C=O (1637cm-1) and the C-O-C stretching vibration of polysaccharides (960-1150cm-1) [1,2]. The intensity and peak positions in the μm-FTIR data clearly demonstrated that the relative contents of chemical groups are distinctly different. These observations demonstrate that the biofilms and the associated EPS consisted of different components. On the mechanism of EPS attachment on the mineral, the most reasonable interpretation is that charge effects are involved whereas molecules acting as Lewis acids by accepting electrons from the mineral-sulfur, like EPS-complexed iron species, will preferentially strongly attracted. The selective attachment to mineral ores is associated with the occurrence of distinct dislocation sited, where sulphur atoms are accumulated.

Conclusion

Raman microspectroscopy and micro-FTIR mapping/imaging are structure sensitive techniques that have been applied successfully in our laboratory for over 30 years towards our understanding of the characterization of the structure-function relationship in biomolecules, and recently in minerals, and in monitoring the steps governing whole ore bioleaching [1-14]. FTIR is well established as a method for studying solid state transformations in minerals and bio minerals and micro-FTIR extends this functionality to include spectroscopic mapping at the micrometer length scale. The achievement of chemical and structural mapping of (bio)-minerals opens new horizons for our understanding of mineral arrangements and variability in biological systems. Based on our results we propose a mechanism for the sequential steps for chalcopyrite bioleaching in which chalcopyrite is converted initially to Cu2S, and subsequently to CuS. K+- jarosite formation is not followed by the formation of NH4+- jarosite as it was observed in the case of chalcopyrite. The role of the microenvironment filled with EPS which contains sugars, fatty acids and lipids and formed between the bacterium and the metal sulfide surface is distinct in each case. The dynamics of the EPS which are essential for cell attachment and metal sulfide leaching is time-dependent.

Acknowledgement

Financial support by the European Regional Development Fund and the Republic of Cyprus through the Research Promotion Foundation (Grant No ENTERPRISES/0916/0069) is gratefully acknowledged.

References

  1. Adamou A, Manos G, Messios N, Georgiou L, Xydas C, et al. (2016) Probing the whole ore chalcopyrite-bacteria interactions and jarosite biosynthesis by Raman and FTIR microspectroscopies. Bioresour Technol 214: 852-855.
  2. Adamou A, Nicolaides A, Varotsis C (2019) Bio-hydrometallurgy dynamics of copper sulfide- minerals probed by micro-FTIR mapping and Raman microspectroscopy. Minerals Engineering 132: 39-47.
  3. Pinakoulaki E, Varotsis C (2008) Nitric oxide activation and reduction by heme-copper oxidoreductases and nitric oxide reductase. J Inorg Biochem 102(5-6): 1277-1287.
  4. Pinakoulaki E, Varotsis C (2003) Time-resolved resonance raman and time-resolved step-scan FTIR studies of nitric oxide reductase from Paracoccus denitrificans: Comparison of the heme b3-FeB site to that of the heme-CuB in oxidases. Biochemistry 42(50): 14856- 14861.
  5. Varotsis C, Woodruff WH, Babcock GT (1990) Time-resolved Raman detection of .mu.(Fe-O) in an early intermediate in the reduction of oxygen by cytochrome oxidase. Journal of the American Chemical Society 112(3): 1297-1297.
  6. C Koutsoupakis, Pinakoulaki E, Stavrakis S, Daskalakis V, Varotsis C (2004) Time-resolved step- scan Fourier transform infrared investigation of heme-copper oxidases: implications for O2 input and H2O/H+ output channels. Biochimica et Biophysica Acta (BBA)-Bioenergetics 1655(1-3): 347-352.
  7. Iwase T, Varotsis C, Shinzawa Itoh K, Yoshikawa S, Kitagawa T (1999) Infrared evidence for CuB ligation of photodissociated CO of cytochrome c oxidase at ambient temperatures and accompanied deprotonation of a carboxyl side chain of protein. Journal of the American Chemical Society 121(6): 1415-1416.
  8. Pinakoulaki E, Ohta T, Soulimane T, Kitagawa T, Varotsis C (2004) Simultaneous resonance raman detection of the heme a3-Fe-CO and CuB-CO Species in CO-bound ba3-Cytochrome c Oxidase from Thermus thermophilus evidence for a charge transfer CUB CO Transition. Journal of Biological Chemistry 279(22): 22791-22794.
  9. Koutsoupakis C, Soulimane T, Varotsis C (2003) Docking site dynamics of ba3-cytochrome c oxidase from Thermus thermophiles. Journal of Biological Chemistry 278(38): 36806-36809.
  10. Stavrakis S, Pinakoulaki E, Urbani A, Varotsis C (2002) Fourier transform infrared evidence for a ferric six-coordinate nitrosylheme b3 complex of cytochrome cbb3 oxidase from Pseudomonas stutzeri at ambient temperature. The Journal of Physical Chemistry B 106(50): 12860-12862.
  11. Varotsis C, Vamvouka M (1999) Resonance raman and fourier transform infrared detection of azide binding to the binuclear center of cytochrome bo3 oxidase from Escherichia coli. The Journal of Physical Chemistry B 103(19): 3942-3946.
  12. Babcock GT, Varotsis C, Zhang Y (1992) O2 activation in cytochrome oxidase and in other heme proteins. Biochimica et Biophysica Acta (BBA)-Bioenergetics 1101(2): 192-194.
  13. Pinakoulaki E, Yoshimura H, Yoshioka S, Aono S, Varotsis C (2006) Recognition and discrimination of gases by the oxygen-sensing signal transducer protein HemAT as revealed by FTIR spectroscopy. Biochemistry 45(25): 7763-7766.
  14. Ohta T, Pinakoulaki E, Soulimane T, Kitagawa T, Varotsis C (2004) Detection of a photostable five-coordinate heme a3-Fe-CO species and functional implications of His384/α10 in CO- bound ba3-cytochrome c oxidase from Thermus thermophiles. The Journal of Physical Chemistry B 108(18): 5489-5491.

Friday, February 25, 2022

Periodontal Diagnosis: Shall Saliva and Gingival Crevicular Fluid Help the Clinician?_Crimson Publishers

 Periodontal Diagnosis: Shall Saliva and Gingival Crevicular Fluid Help the Clinician? by Discepoli Nicola in Modern Research in Dentistry_Dentistry and Oral Health Journal


Introduction

Periodontal diseases are a group of inflammatory/infectious, multifactorial, diseases. The periodontal tissues house both microbial dysbiosis and host response dysregulation [1]. The most recent hypothesis about the pathogenesis of periodontal disease deals with the biological transition from a healthy periodontal tissue to a pathological one (characterized by inflammation and loss of clinical attachment). This transition is mediated by the dysregulation of the inflammatory response, caused by the presence of keystone pathogens. These bacteria (i.e. Porphyromonas gingivalis) differ from normal commensal bacteria: they are able to alter the inflammatory response even in minimal quantities [2,3]. In fact, the proactivity of these species (keystone) increases the nososymbiocity of the dental biofilm without increasing its biomass [4].

This outbreak of the inflammatory response represents the pathological mechanism underlying periodontal disease. Individual variability in host response pathways may result in variations on the degree of inflammation, both in terms of response and resolution [5]. This feature, together with patient’s behavioral habits, determine the heterogenic nuances (i.e. disease phenotypes) noticeable among individuals. Loss of clinical attachment (CAL loss) represents the pathognomonic sign of periodontitis: it yields two different clinical scenarios namely pocketing and gingival recession. Younger individuals seem to express loss of attachment through the latter mechanism, while pocketing becomes the main mode of disease progression as subjects get older [6]. Many longitudinal studies, dealing with the natural history of periodontal disease and carried out among different untreated populations, have highlighted a common pattern of disease progression [7-9]. Usually, it is relatively slow and site-specific: interproximal sites are more prone to be affected by pocketing, whilst mid-buccal and mid-lingual sites mainly through recession [10]. Previous studies have reported that patients showing a high level of gingival inflammation and chronic bleeding on probing are more likely to develop destructive periodontal disease, while further relapses of the disease are best predicted by the current signs and symptoms [11]. The effectiveness of clinical diagnostic procedures for intercepting disease progression is minimal. The progression of Periodontitis, indeed, is not linear. Since the 80’s, results from longitudinal studies on untreated subjects suggested the so called “Burst hypothesis”, as a possible explanation to how clinical attachment loss takes place over time. This model describes the development of loss of attachment as an asynchronous alternance between sudden tissue loss (“burst”) and phases of stability [12]. Recently, a new model was proposed to interpret disease progression [13,14].

It is based on a Linear Mixed Model (LMM) analysis that is supposed to overcome some short comings (site and patient level source of errors, reliability) of the previously proposed model. Considering the clinical and methodological features of the existing procedures, the therapist is called to face a disease without the tools for pinpointing a true state of “activity” of the disease. In fact, the evaluation of clinical attachment loss (CAL loss) identifies sites that have already experienced disease. CAL loss, measured by probing pocket depth and recession, represents the history of the disease experienced by the patient, but it holds very low reliability regarding the current and future course of the disease. Due to its chronic nature, an early detection of disease and disease activity is of paramount importance. In this perspective, recent scientific evidence suggests how saliva and gingival crevicular fluid (GCF) could contribute to its early detection. These fluids are a copious source of biological biomarkers eventually able to identify, way before clinical diagnosis, an imbalance between the host response and the biofilm.

That being said, which biomarkers are suitable to help the clinician?

In this perspective, scientific community has paid close attention to both saliva and GCF. In 2018, a new classification system for periodontal diseases was introduced. The newly proposed framework entails the incorporation of future potential biomarkers in order to integrate the information provided by the standard clinical measures. A recent systematic review [15] analyzed 32 biomarkers through a meta-analytical approach to test their diagnostic ability: sensitivity and specificity were collected in otherwise healthy subjects. The most frequently studied salivary biomarkers were MMP-8, IL-1 beta, IL-6, MMP-9 and Hb. They all showed a good capability to detect periodontitis, highlighted by a sensitivity value of more than 70%. Furthermore, IL1 b and MMP-9 displayed also a good specificity (around 80%).

Among these bio products, MMP-8 deserves special interest. It is probably the most investigated marker. Moreover the market offers a chair side/point of care oral fluid test, based on the detection of MMP-8, that has shown promising results in identifying active periodontal tissue destruction among populations of different ethnicities and with comorbidities [16-18]. Recently, the saliva concentration of MMP-8 was also directly related to staging and grading [19]. The MMP-8 levels in mouth rinse were significantly lower among healthy patients compared to individuals with advanced periodontal destruction. The scenario regarding gingival crevicular fluid is quite similar to that described for saliva. Among the biomarkers with the highest level of evidence, MMP-8 displayed a good sensitivity and an excellent specificity (76, 7% and 92% respectively) according to recent metanalytic data [15].

Conclusion

From a clinical standpoint, the use of a biological marker as a diagnostic tool could play a pivotal role in the very first steps of diagnosis. The possibility of carrying out an initial “triage” to subsequently identify which cases deserve a supplementary diagnosis represents a very close and useful horizon for the clinician.

References

  1. Meyle J, Chapple I (2015) Molecular aspects of the pathogenesis of periodontitis. Periodontology 2000 69(1): 7-17.
  2. Hajishengallis G, Lamont RJ (2012) Beyond the red complex and into more complexity: The polymicrobial synergy and dysbiosis (PSD) model of periodontal disease etiology. Molecular Oral Microbiology 27(6): 409-419.
  3. Bostanci N, Bao K, Greenwood D, Silbereisen, Belibasakis GN (2019) Periodontal disease: From the lenses of light microscopy to the specs of proteomics and next-generation sequencing. 1st edn, Elsevier Inc., Advances in Clinical Chemistry 93: 263-290.
  4. Proctor D, Shelef KM, Gonzalez A, Davis CL, Dethlefsen L, et al. (2019) Microbial biogeography and ecology of the mouth and implications for periodontal diseases. Periodontology 2000 82(1): 26-41.
  5. Van Dyke TE, Kornman KS (2008) Inflammation and factors that may regulate inflammatory response. J Periodontol 79(8 Suppl): 1503-1507.
  6. Schätzle M, Löe H, Lang NP, Heitz Mayfield LJA, Bürgin W, et al. (2003) Clinical course of chronic periodontitis: III. Patterns, variations and risks of attachment loss. Journal of Clinical Periodontology 30(10): 909-918.
  7. Loe H (1979) The natural history of periodontal disease in man. Journal of Periodontal Research 14(6): 526-540.
  8. Goodson JM, Haffajee AD, Socransky SS (1984) The relationship between attachment level loss and alveolar bone loss. Journal of Clinical Periodontology 11(5): 348-359.
  9. Baelum V, Luan WM, Chen X, Fejerskov O (1997) A 10-year study of the progression of destructive periodontal disease in adult and elderly Chinese. Journal of periodontology 68(11): 1033-1042.
  10. Thomson (2006) Changes in periodontal disease experience from 26 to 32 years of age in a birth cohort. Journal of Periodontology 23(1): 1-7.
  11. Haffajee AD, Socransky SS, Lindhe J, Kent RL, Okamoto H et al. (1991) Clinical risk indicators for periodontal attachment loss. Journal of Clinical Periodontology 18(2): 117-125.
  12. Goodson JM, Tanner AC, Haffajee AD, Sornberger GC, Socransky SS, et al. (1982) Patterns of progression and regression of advanced destructive periodontal disease. Journal of Clinical Periodontology 9(6): 472-481.
  13. Teles R, Benecha HK, Preisser JS, Moss K, Starr JR, et al. (2016) Modelling changes in clinical attachment loss to classify periodontal disease progression. Journal of Clinical Periodontology 43(5): 426-434.
  14. Teles R, Moss K, Preisser JS, Genco R, Giannobile WV, et al. (2018) Patterns of periodontal disease progression based on linear mixed models of clinical attachment loss. Journal of Clinical Periodontology 45(1): 15-25.
  15. Arias Bujanda N, Regueira Iglesias A, Balsa Castro C, Nibali L, Donos N, et al. (2019) Accuracy of single molecular biomarkers in gingival crevicular fluid for the diagnosis of periodontitis: A systematic review and meta-analysis. Journal of Clinical Periodontology 46(12): 1166-1182.
  16. Nwhator SO, Ayanbadejo PO, Umeizudike KA, Opeodu OI, Agbelusi GA, et al. (2014) Clinical correlates of a lateral-flow immunoassay oral risk indicator. Journal of Periodontology 85(1): 188-194.
  17. Johnson N, Ebersole JL, Kryscio RJ, Danaher RJ, Dawson D, et al. (2016) Rapid assessment of salivary MMP-8 and periodontal disease using lateral flow immunoassay. Oral Diseases 22(7): 681-687.
  18. Grigoriadis A, Sorsa T, Räisänen I, Pärnänen P, Tervahartiala T, et al. (2019) Prediabetes/diabetes can be screened at the dental office by a low-cost and fast chair-side/point-of-care aMMP-8 immunotest. Diagnostics 9(4).
  19. Sorsa T, Alassiri S, Grigoriadis A, Räisänen IT, Pärnänen P, et al. (2020) Active MMP-8 (aMMP-8) as a grading and staging biomarker in the periodontitis classification. Diagnostics 10(2): 61.

For more articles in Dentistry and Oral Health Journal
Please click on below link: https://crimsonpublishers.com/mrd/

Thursday, February 24, 2022

Forensic Facial Reconstruction to Identify Skulls-A Review_Crimson Publishers

 Forensic Facial Reconstruction to Identify Skulls-A Review by Sankeerti Mala Bonda in Forensic Science & Addiction Research_Journal of Forensic Sciences


Abstract

Facial Reconstruction- making faces is an old story which has undergone many changes in the techniques mentioned in the literature. Identification of skulls when all other evidence is destroyed or limited requires the usage of facial reconstruction for the forensic team. This review article is a summary of the different facial reconstruction methods and their role in forensic science to identify the individual.

Keywords: Facial reconstruction; Forensic science

Introduction

Facial reconstruction-making faces are an old story. In ancient Egypt, great efforts were made by scientists to preserve as many details of their ancestors as they could. Late in the 19th century, anatomists, anthropologists and forensic odontologists began to study the correlation between the surface soft tissues of the face and the underlying bony structure of the skull. In modern times, facial reconstruction has been developed in order to help archaeologists in their attempts to demonstrate the appearance of early man. Also, recently in forensic science in order to produce an image from a skull, which offers a sufficient likeness of the living individual [1].

Skulls can survive for centuries, even millions of years and can provide an unrivalled means of identification [2]. If a skull is accidentally recovered from a garden, forest etc, a positive identification will be needed. In cases where traditional methods of identification like dental records examination, radiography, DNA analysis etc, cannot be used or have been ineffective, forensic facial reconstruction can be used as an important tool which may help in facial recognition of the skull and lead to identification of an individual [3].

Faces are fascinating. The bones of the skull are a key determinant of facial appearance. They form the basic framework to which other tissues are attached and how a person looks depends on all these factors together-skin, muscle, fat and bone. In human beings, the basic look is similar but we are very sensitive to the small differences that can be used for identification purposes [2].

Techniques of facial reconstruction [1,4]

a. Plaster skull reconstruction (combination Manchester method/ British method)

b. Skull / photo video superimposition

c. Computerized 3D facial reconstruction

d. Anthropometerical American method/ Tissue depth method

e. Anatomical Russian Method.

Each approach utilizes either a manual or computer generated method. Computer generated models are particularly important to focus on in light of technological advances that have been made in recent years and the increasingly heavy reliance on these methods.

Regardless of the method used, approaches can be broken down into three basic schools of thoughts: anatomical, anthropometrical and combination. The anatomical view is heavily influenced by the prevalence of musculature in defining the shape of the reconstructed face, while anthropometrical view focuses on the average tissue depth of the face as the key factor. The combination view is a way of merging the anatomical and anthropometrical, with average tissue depth serving to confirm details obtained by looking at the muscle and bone structure. The method chosen determines the measurements and formulas that one uses and the level of objective and subjective influences [5].

Plaster scalp reconstruction technique

This is a traditional technique which requires the eyes and hands of an artist and the specialized knowledge of an anatomist. The method involves the preparation of a cast of skull (both cranium and mandible together fit with false eyes). On the cast, 3 mm diameter pegs are fitted to the distance according to the thickness of the soft tissues regarding the age, sex, ethnic group and mainly the appropriate set of measurements.

a. Medial and Lateral canthi of the eyes is marked with a copper pin.

b. 1 or 2 pegs from the nasal aperture.

The progression of muscle building in temporal muscle, masseter, buccinators, orbicular oris. Position and strength of muscle insertions should be noted. The width of the mouth is determined by the outer borders of the canine teeth. When teeth are missing, the distance between the inner borders of the iris is considered next the expression muscles are added-levator anguli oris, levator labii superioris, zygomaticus major and minor, depressor labii inferioris and depressor anguli oris. Space between them should be supported to prevent them from collapsing.

The width of the nasal aperture in the skull is equal to the three fifth of the overall nose’s width. Then the whole cast is to be covered by a layer of clay to simulate the outer layers of subcutaneous tissues and skin. The modelling of the superficial features makes a face look alive. The average success rate is between 50% and 60% [1,6-8].

Skull/photo video super imposition

This method was first described by Kenna [9]. This method is useful when ante-mortem photographs of 1 or more possible descendants are available. The skull to be identified is mounted on an adjustable support. A high resolution video camera is aligned at right angles with the ante-mortem photograph. A second video camera is aligned with the skull. The center of the lens must be at the same level as the horizontal center of the photograph. The 2 images from each camera are processed in a vision mixer, for horizontal, vertical wiping and super imposition and negative stimulation.

If teeth are present, the enlargement can be carried out until the teeth in the ante mortem photograph exactly overlaps the teeth in the super imposed video picture. If teeth are not present, estimation should be made by adjusting the vertical height of the photograph of that of the skull [1,9,10].

Compterized 3D facial reconstruction

This method employs computer programs to transform laserscanned 3D skull images into faces. Although the results are more reproducible than sculpted reconstructions, some subjectivity could remain in the pegging of a composite facial image onto the digitized skull matrix [1].

A database of head models (both skulls, faces and soft tissue depth with their personal characters (age, sex, race and nutrition status) is required. The remains of the deceased are examined by the forensic team and the information provided is utilized in order to chose the appropriate skull and soft tissue templates [11-13].

The skull is positioned in a padded head holder. The longitude changes as the skull rotates on the platform and the radius is measured for each latitude. A wire frame of 256 x 256 radii is musconstructed which must be transformed using tissue depth measurements to generate the foundation of the facial reconstruction. The facial features not predicted by the skull contours ( nose, eyes, mouth) must be added with separate means to generate a wire frame face onto which colour and texture are rendered [11,14].

Anthropometerical american method/ tissue depth method

This technique first developed by Krogman in 1946, uses soft tissue depth data which are obtained by the use of needles, x-rays or ultra sound. Facial muscles are recorded in a proper anatomical manner. This technique is not preferred now-a-days as it requires highly trained personnel [4].

Anatomical Russian method

This method developed by Gerasimov in 1971, does not uses soft tissue depth data but facial muscles were used in anatomical position.

Discussion

Several forensic scientists have criticized facial reconstruction for the accuracy of the method and its failing to create exact replicas of an individual. However forensic facial reconstructions will only produce images that are a gross approximation which may be an alternative method in the identification process where no other evidence is available.

However the choice of method of facial reconstruction depends upon the information provided by the team of a forensic pathologist, forensic anthropologist, forensic odontologist and the investigation team.

The technique of plaster face reconstruction requires the information of age, race, sex, nutrition status, to assess the soft tissue thickness data. Furthermore the details of nose, eye, ear, lips and chin cannot be constructed exactly from the skull and are largely guess work [13].

However in case of ante mortem photographs to be matched with the skull remains, the skull/ photo video super imposition technique can be of great advantage as the operator’s ability to fade either the skull or ante mortem photograph in and out of the video screen and can assess how well they match [9,10,15].

But the possibility that other skulls could fit all the facial features of a photograph could occur and therefore this technique is best used in exclsion rather than identification and to supply corroborative evidence [1]. In Australian courts of law, video super impositions has been accepted as a means of identifying skeletal remains when other methods of identification are not reliable [1,10,15].

Computer assisted facial reconstruction has many benefits compared to classic methods. It eases the procedure, the amount of time spent on proposing a facial model is greatly reduced. Several possible models can be moved under several angles increasing the probability of identification of individual [14].

Characteristics of facial features, namely the eyes, nose, mouth, and ears. Efforts have been made to produce standards that can be used for feature prediction. Research has shown that there exists a “significant correlation between eyeball protrusion and orbital depth” for instance [5].

The nose has proved more difficult to reliably assess, with the best method proving to be the two-tangent method first proposed in 1955 [5]. The width and thickness of the mouth have been demonstrated to be positively correlate to the distance between the irises or an inter canine width and teeth height respectively [5]. Despite the many ways to predict the specific characteristics of facial features, a great deal of the accuracy is still attributed to the discretion of a skilled analyst.

Conclusion

Facial reconstruction is a delicate mixture of art and science and with the evolution of innovative methods of facial reconstruction has evolved tremendously. Even though the accuracy of these techniques are questionable, these techniques prove to be a major tool for the forensic team in the identification of the individual when no other source of evidence is available.

References

  1. Stavrianos Ch (2007) An introduction to facial reconstruction. Balk J Stom 11: 76-83.
  2. Verze L (2009) History of facial reconstruction. Acta Biomed 80(1): 5-12.
  3. Fernandes CM, Pereira FD, da Silva JV, Serra Mda C (1998) Is characterizing the digital forensic facial reconstruction with hair necessary? A familiar asssessors’ analysis. Forensic Sci Int 229(1-3): 164.e1-164.e5.
  4. Sonia G (2015) Forensic facial reconstruction: the final frontier. Journal of Clinical and Diagnostic Research 9(9): ZE26-ZE28.
  5. Lee WJ, Mackenzie S, Wilkinson DC (2011) Forensic Aanthropology 2000-2010. CRC Press, USA.
  6. Neave RAH (1979) Reconstruction of the heads of three ancient Egyptian mummies. J Audiov Media Med 2(4): 156-164.
  7. Prag J, Neave R (1999) Making faces. London: British Museum Press, China.
  8. Neave RAH (1989) Reconstruction of the skull and the soft tissues of the head and face of Lindow Man. Canadian Soc Forensic Sci J 22(1): 43-53.
  9. McKenna J, Jablonski N, Fearnhead R (1984) A method of matching skulls with photographic portraits using landmarks and measurements of the dentition. J Forensic Sci 29(3): 787-797.
  10. Bastiann RJ, Dalitz GD (198) Video superimposition of skulls and photographic portraits-A new aid to identification. J Forensic Sci 31(4): 1373-1379.
  11. Tyrell AJ, Evison MP, Chamberlain AT, Green MA (1997) Forensic threedimensional facial reconstruction: historical review and contemporary developments. J Forensic Sci 42(4): 653-661.
  12. Miyasaka S, Yoshino M, Imaizumi K, Seta S (1995) The computeraided facial reconstruction system. Forensic Sci Int 74(1-2): 155-165.
  13. Shahrom AW, Vanezis P, Chapman RC, Gonzales A, Blenkinshop C, et al. (1996) Techniques in facial identification: computer-aided facial reconstruction using a laser scanner and video superimposition. Int J Legal Medicine 108(4): 194-200.
  14. Myers JC, Okoye MI, Kiple D, Kimmerle EH (1999) Three dimensional (3- D) imaging in post-mortem examinations: elucidation and identification of cranial and facial fractures in victims of homicide utilizing 3-D computerized imaging reconstruction techniques. Int J Legal Med 113(1): 33-37.
  15. Iscan MY, Helmer RP (1993) Forensic analysis of the skull. Wiley Liss, New York, USA, pp. 105-182.

For more articles in Journal of Forensic Sciences
Please click on below link: https://crimsonpublishers.com/fsar/

Wednesday, February 23, 2022

The Existence of Carpet Industry in Bhadohi, India_Crimson Publishers

 The Existence of Carpet Industry in Bhadohi, India by Badri Narayanan G in Trends in Textile Engineering & Fashion Technology_Fashion Technology open access journals


Abstract

Indian carpet is famous worldwide for its premium quality and texture. India controls almost 40 percentages of worldwide export volume. US is the largest importer of carpet from India in previous years. Bhadohi-Mirzapur region of Uttar Pradesh is famous for GABBE Woollen carpet in India and outside India. The carpet manufactured here are mainly export centric. This belt is famous from the age of Akbar regime. The Persian design is the primary attraction of the carpet manufactured here. The weavers are especially skilled to give the artistic form of the design with their hands to the carpet. But being the bottom of pyramid they get absolutely share of profit the businessmen and exporter company make. They are exploited by the middleman in every respect. The wages they get are so less that it makes them to leave the job and switch to other manual jobs. If a social enterprise or cooperative society could be setup them they could get the justice of being paid for what the labour they do.

Keywords: GABBE woollen carpet; Persian design, Social enterprise; Cooperative society

Introduction

The carpet weaving had been started way long back in 16th century in Mughal era.In current scenario India is the largest producer and exporter of carpet in the world in term of both volume and value. Approximately80 percent of carpet manufactured in India are exported. India is popular in global market for its excellent design especially Persian design. India has pioneered as largest exporter of handmade carpets. Hand-knotted woollen carpets, tufted woollen carpets, chain stitch rugs, pure silk carpets, synthetic carpets, handmade woollen durries are some of the demanding products in the European and American market. Exports of handmade carpet were 558.14 million USD in April- July 20171 [1]. India singlehandedly controls 40 percent of export worldwide. Indian carpet has market access in 73 countries2 and US being the largest [2]. The carpet export promotion council is the apex body of exporters of the handmade carpet. The council help in terms of finding new market, refinancing activity, worldwide events participation, arranges international buyer seller meets and resolving trade disputes. Currently Rajasthan, Kashmir, Punjab, Uttar Pradesh, Andhra Pradesh and Himachal Pradesh are the major states in which carpet industry is flourished. The carpet industry has a huge growth potential but lack of innovation, out dated technology was considered as devil factors to prohibit growth.To facilitate innovation and technology upgrade, Ministry of Textiles, Government of India set up the Indian Institute of carpet technology in Bhadohi, Uttar Pradesh in the year of 2001. It was first of its kind in Asia to develop human resource for the up gradation of the carpet industry in India. It has both national and international collaboration.

Objective of study

The objective of our study is

  1. To understand the carpet industry in Bhadohi: Status of weavers
  2. Find feasible solution to improve labour life

Questionnaire

Semi structured and unstructured interview was taken by us of the carpet weaver in the village Raipur and nearby village of Raipur of Bhadohi district of Uttar Pradesh. The following information we had collected.

Basic information

The respondent’s name, age, highest educational qualification and number of dependant member on his/her earning were asked.

Occupational information

From how long the person is engaged in this occupation, what is the average wage he/she earn in how much working hours, willingness to work in this industry and alternative livelihood option available were asked. Also, the way they got the contract to work as labourer was asked.

Process of Data Collection

Data has been collected from following sources

Primary source

In this we had visited the household which are engaged now and engaged before in carpet weaving job. Semi structured and unstructured interview were taken.

Secondary source

Data has been collected from various online resources available like Central Export Promotion Council’s website, India Brand Equity Foundation’s website etc.

Indian Carpet Industry

History of carpet in India3

Presence of carpets could be traced into 500 B.C. in Indian subcontinents. We can find the mention of floor covering and mats in medieval Indian literature [1].Babur came to India and missed the Persian carpet too much. Thus, Akbar introduced Persian design carpet weaving in India in 1580 A.D. in Agra palace. Mughal carpetswere as obscure as their miniatures and usually depicted court life, animals and floral decorations. Mughal carpets were brightly coloured and the hand knotted silk carpets had 4224 knots per square inch. But the pie carpet was dominant in that time. From the beginning, wool or silk was the prime material for carpet weaving. Wool carpet has a diversified origin but the silk knots are used in Kashmir region.The patterns of Indian carpets varied from vines and floral patterns, animal and bird figures and geometric and calligraphic patterns. Rugs from Akbar’s reign started using cotton wrap and wool pile and a colour scheme made up of multiple shades of blues, greens and other colours on a red or peach base. The patterns were just replica of Persian style and customised for Indian culture and tastes. During Jahangir’s reign (1605-27) were more magnificent. Usage of silk and pashmina permitted more number of knots resulting more tight texture. These patterns led to more miniature paintings. Subtle gradations and shadings with yarns were themselves artistic.The patterns of these carpets were a reflection of manuscript paintings. From this time, the Indian carpet showed technically refined taste in design and construction. He carpets had scrolling vines, flowering plants, and more naturalistic animals in pictorial or overall pattern. During Shahjahan’s ruling (1628-58) the Indian carpet had attained new heights. 2000 knots per square inch was introduced using silk yarns. Velvety like texture was attained using silk or pashmina piles. Yarn shading was as stylish as in Jahangir`s reign. Flower design was prevalent in this time. Yarn shading was as stylish as in Jahangir`s reign. During this time, Chinese and European patterns also influenced the Indian carpet. Calligraphy influenced the carpet craft as it did the other crafts in India. In 1958 there were 14 factories with 350 looms and 80 cottage units with 400 looms. According to a survey in India, there were about 3500 carpet weavers in 1974.By the end of eighties their total number reached about 48000 people.

Types of carpet in India 4

Synthetic carpets: These carpets are made up of synthetic fibres. It delivers superior strength when compared to natural fibre carpets. It has a wide application in military, industry and horticultures. Synthetic carpets are not human health friendly.

Pure silk carpets: Made up of completely from silk and captures a great human imagination.In most carpet belts, manufacturing and weaving silk carpets is a family business where the secrets and techniques are transferred from one generation to the following ones.

GABBE woollen carpet: These carpets are predominantly produced in the Bhadohi- Mirzapur regions of Uttar Pradesh. This kind of carpet uses indigenous and unique tradition of various tribal patterns, which are very antique and elegant in design. These carpets are costliest in the market with comparison to all other available in India. It is believed that it’s generally made of 25% cotton and 75% wool but actual composition is still unknown.

Tufted woollen carpets: These types of carpets are made by both hand and machine. These types of rugs can be produced easily and inexpensively. It has more colour variety and patterns. It is the best-looking carpet in market. It contributes more to the export volumes.

Handmade woollen durries: These types of carpet are made up of the finest wool resulting look better and beautiful. These carpets can be weaved only by some specific communities living in the inlands of India. These carpets are custom made according to the required design and quality of the clients.

Wool chain stitch rugs: These rugs are made by loosely twisting the yarn on cotton or linen based materials.These types of rugs are very famous and are placed at most of the museum and exhibition around the world.Rotating from the centre, the rows of this type of rugs create solid and stylish patterns making a clear embossed feeling to add different textures.

Hand-knotted woollen carpets: Well-liked for its elegant style and unique craftsmanship, these types of carpets are adored all around the world. There are many carpet manufacturers who offer customized carpets for clients as they require.

Carpet export from India 5

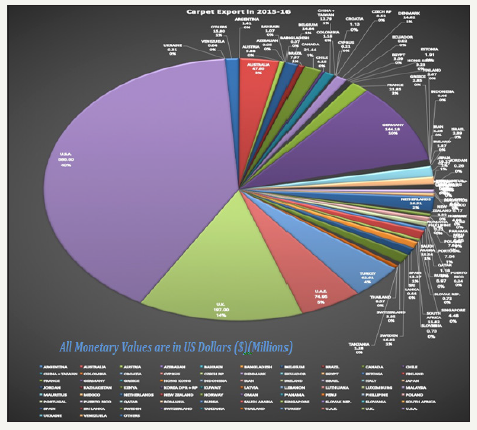
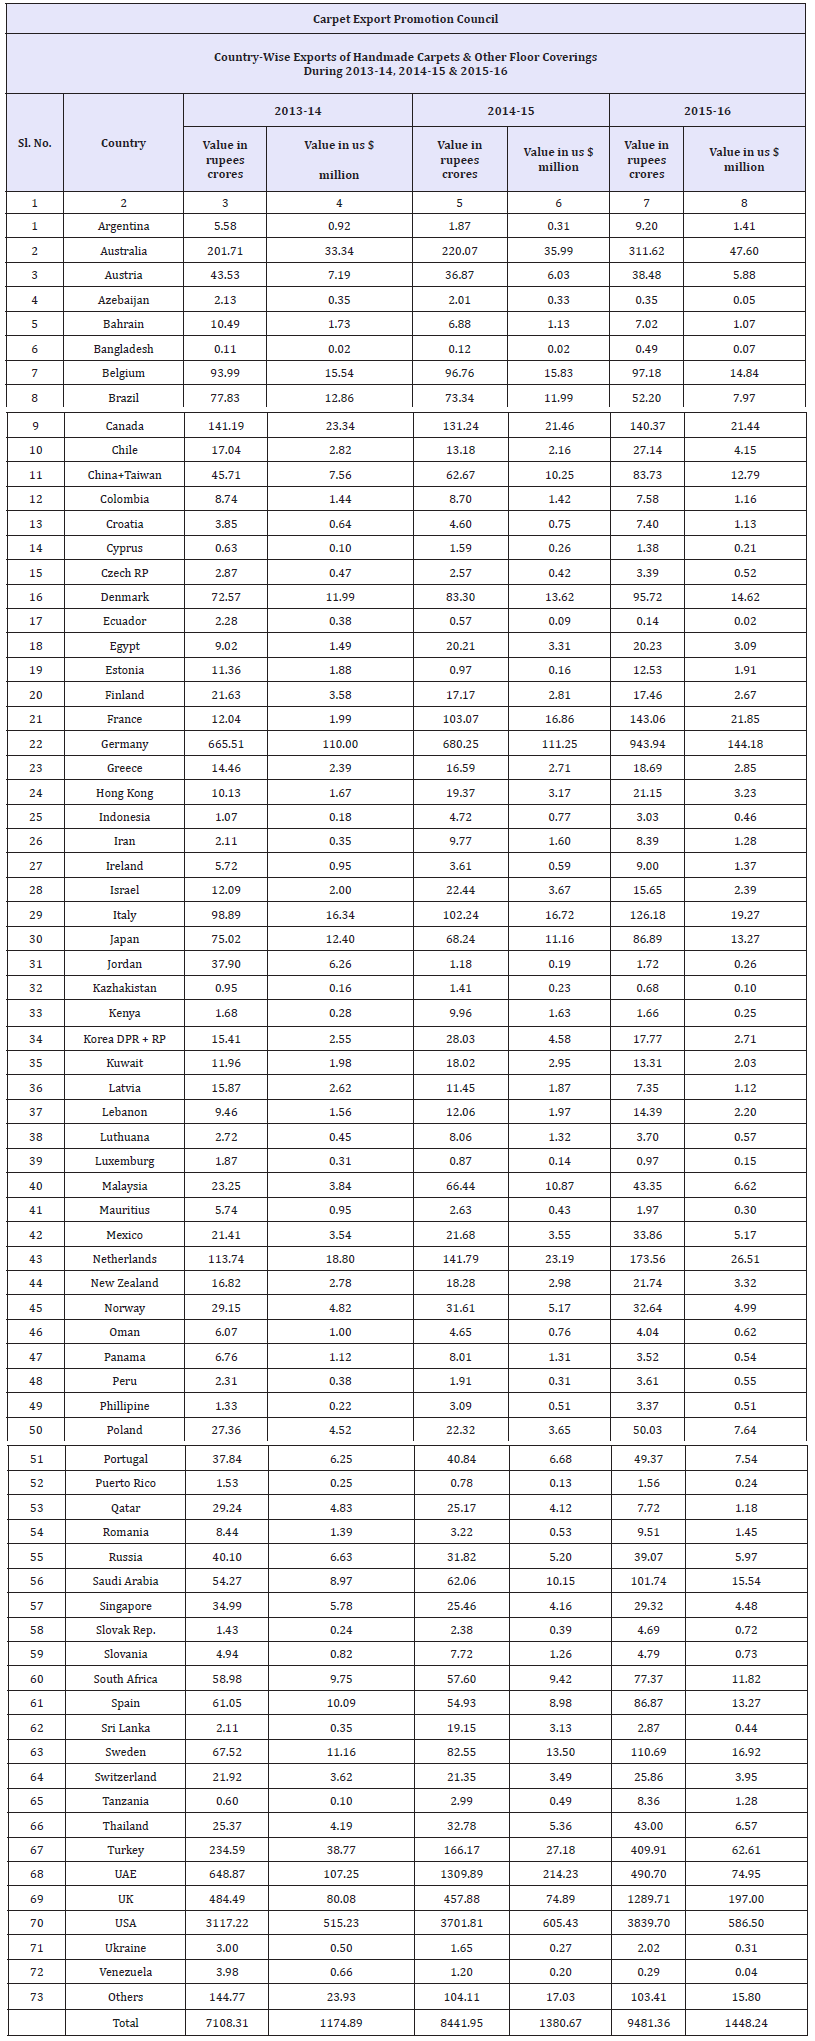
From the above export data(Table 1)[3], we can see in the financial year 2015-16 US was the top importer of carpet resulting 40 percentage contribution and UK being the second highest resulting 14 percentage contribution(Figure 1).

figure 1:


Table 1:

*Source:DGCI&S [3]


Carpet Industry in Bhadohi

Background of Bhadohi

Bhadohi carpet is famous for its various knots and counts designs. This belt specialises in Woollen, Tufted, Tibetan Carpet and Durries. The whole belt of production spread over 1000 square kilometres6 and many villager’s livelihood is completely dependent on the carpet industry.The Indian Institute of Carpet Technology, the only Institute of its kind in Asia was established here by the Ministry of Textiles in 2001. The town of Bhadohi, which gives its name to the Pargana and the Tahsil, is situated in Lat 25 ̊23 ̍ N. and Long 82 ̊34 ̍ E7 at the distance about thirty miles from west of Varanasi, twelve miles north-east of Gopiganj and about three miles south of the river Varuna. It is connected with Jaunpur by a provincial highway and with Gopiganj by a mettaled road running via. Gyanpur connecting the road from Bhadohi to Suriawan and Parsipur.

History8

Bhadohi and its adjoining areas have no production or availability of various raw materials used in carpet making but these are the places where the carpet industry was founded and flourished tremendously[4]. The ancient history of carpet making in India goes long back and it was Emperor Jahangir was contemporary of Shah Abbas of Iran. Both the kings were friends. It is a well-known historical fact that during the regime of Shah Abbas, the carpet industry made a spectacular progress. He took special interest in developing new attractive designs and some of them are popular even today. Emperor Jahangir ruled India in the 16thcentury A.D and his capital was Akbarabad (Agra) where he encouraged this handicraft. After 1857A.D war of freedom which was named by Britishers as Mutiny, Agra, Delhi and other places were full of turmoil and subsequently a number of carpet weavers fled from Agra and got shelter in the village of Madhosingh on the G.T. road located between Bhadohi and Mirzapur and started carpet weaving on a very small scale. Perhaps it was during the late 19thcentury that one Mr. Brownford noticed those making carpets and realized its economic viability and decided to establish a company under the name and style of M/s. E. Hill & Co. in the small village of Khamaria. It was followed by Mr. A. Tellery who got his factory established in Bhadohi. His eldest son Mr. Brownford noticed those making carpets and realized its economic viability and decided to establish a company under the name and style of M/s. E. Hill & Co. in the small village of Khamaria. It was followed by Mr. A. Tellery who got his factory established in Bhadohi. His eldest son Mr. Otto Tellery was one of the founder members of the All India Carpet Manufacturers Association and was the first president of the organization. Next to these two gentlemen, a group of three Europeans formed a company by the name of M/s Obeettee. The group comprised of Messrs. Oklay, Bowden and Tallor the abbreviation of these three is Obeettee.

Production process9

The production follows these following steps.

Designing: It’s the first step toward a beautiful and elegant looking carpet. It’s little bit high paying job as compare other labourintensive job in this industry. The designer is called nakshakar. The nakshakar expresses his imagination in a hard paper sheet or cloth piece. The weaver will follow the design to weave.

Dyeing:The dyeing of wool is a delicate process which varies according to the dyestuff used and the colour desired. Commercially this process is directed by a master dyer, who is highly skilled and respected craftsman in a profession that demands accuracy as well as skill. This process is accomplished in hot chamber for even dyeing of wools. And then the wools are dried in open space under the sun.

Process of weaving: The weaver then gets the mixed up and cross puzzled wool bundle measured in kilogram from a contractor. Then they employ themselves or women or children of the family to open them up to proper threads of desired thickness and strands. Then they weave the carpet using the katharrangement.

Washing: After the weaving process is completed the contractor takes the carpet back again measured in kilogram. Then the carpet is being washed thoroughly to wash out the dusts and extra cotton and wool micro-particles.

Finishing and packaging:Then the carpet is further subjected to inspection for texture and colour evenness of design. After they do some manual adjustment it proceeds for packing and shipping.

Labour life in carpet industry, Bhadohi10

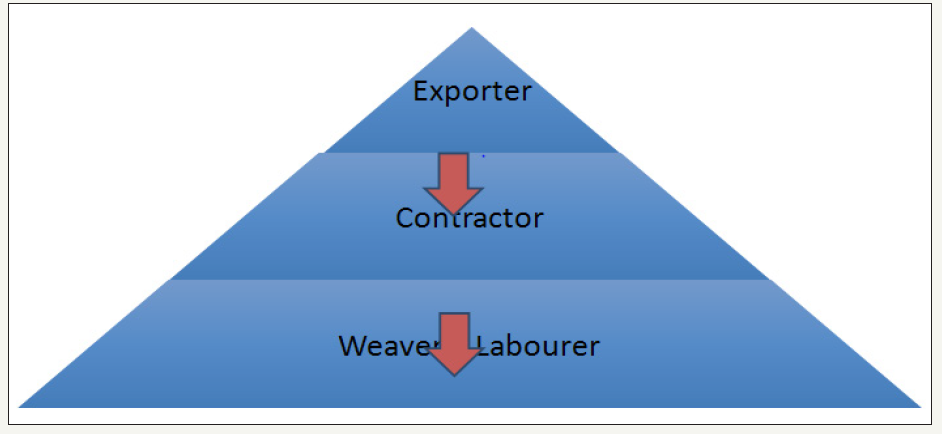
figure 2:


Work flow: The carpet industry has employed a wide range people with respect to age, gender and caste. The backward classes are employed as the skilled and semi-skilled labourer in most of the cases. The upper-class people predominantly male are employed as the middle man, designer or the business entity holder. So there always exists a caste disparity in the village level of the carpet industry hierarchy. In general, the exporter got the purchase order from a customer and got approved with the design of the carpet from them. Then they choose a middle man (Contractor) to get the work done from ground level workers. They provide the contract of manufacturing to the contractor with required amount of dyed wool, yarns, transportation charge and fund for wages and his own cut. The contactor then gets in touch with the weavers who have installedkathin their premise and has employed some labourer to work with him(Figure 2).

The contractor gives them the mixed of yarn and wool. Then the weaver employs some persons to untie these raw materials(Kati) into threads suitable for weaving, especially women of the households do this job. After they get the thread, they mount yarn and wool as required to the kath. The weaver also hires some labourer to work with him and some family members also got associated with it.

Wage:The amount the weaver gets is on the basic of amount carpet being prepared. And for unwrapping and untying of yarn the labourers get wage according to weight of thread resulted.

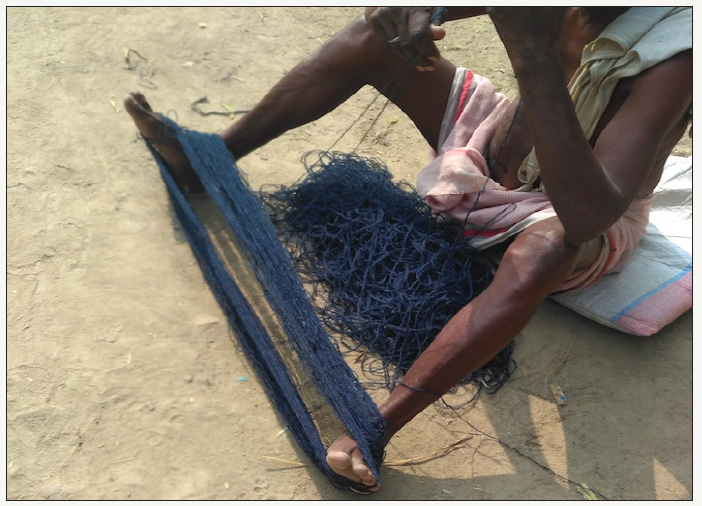
figure 3: A person opening ‘kati’.


figure 4: A weaver is weaving the carpet.


While the weavers get 1200-1800 INR for 1 Foot*9Feet depending the quality of the carpet, the women work for untying on an average 60-70 INR per day depending upon the contactor fund availability. A full carpet is of dimension 6.5Feet * 9Feet(Figure 3 & 4).

Skilled labour wage:The weavers, who are skilled with working using Tufted guns earns bit more per day as they could do more work in one day with respect to the manual weaver. They earn in a range of 200-350 INR per day depending upon the thickness of carpet they are working with. They normally work for companies directly and contractors also.

Semi-skilled labour wage: They generally work at their home and nearby premises. They could earn as much as 100-150 INR per day. They do all work by hand, so too much slow to complete the full carpet. They take as much as 30-40 days to complete a full carpet.

Unskilled Labourer:These are the labourer who work for untying the wools and transportation worker. They are paid very less amount. They don’t have any contract, rather they work on demand.

Migration11

Out bound migration is happening of youths. Possible reason as per the respondents.

  1. Low wages in hand-made carpet industry
  2. Unable to generate sufficient job with growing population
  3. Wage exploitation by the contractors
  4. No job security available

Low wage:In the condition where price of every day to day use commodity is increasing, the wage to work in the handmade carpet has not been increased as par. It’s difficult to feed and educate children and also to sustain family.

Less job generation: The family size is increasing day by day, more youth are coming out to the job market. But the carpet industry has not generated much job to accommodate these new comers. Also, utilization of machines has also further squeezed the new job generation.

Wage exploitation:The weavers get money when they complete the job as per the condition with the contractor. But the irony is when it’s the time to pay the wage to the weaver the contractor also plays many times. Either they give less than they promised or they delay the payment so much that it’s become really hard to sustain family unless they have and alternative livelihood options.

Job security:This industry does not provide job security, employee benefit scheme and medical finance assistance to the weavers and ground level labourer. Thus, new generation youth are not willing to work with this industry at the village level. They are willing to do private job at some companies at Mumbai or Delhi peripheral areas.

Suggestions

In the purview of the above scenario there are few suggestions on which organization can plan its intervention.

Concept of cooperative

A cooperative is “an autonomous association of persons united voluntarily to meet their common economic, social, and cultural needs and aspirations through a jointly-owned and democraticallycontrolled enterprise”12 .

The organisation could mobilise weavers to form their own company completed managed by the stakeholders i.e. the weavers. For the first few years the organisation intervening have to stay attached to the weavers’ cooperative and help them hire marketing and technology professional. For funding the organisation could help the cooperative secure loan from bank of micro financing agency in a joint liability mode.

A. Advantages

In this mode of working the weaver and labourer will get proper wage and also the profit of their work will be shared among themselves. They can further expand their business and employ more people depending upon the requirement and finance available to pay the employee.

B. Disadvantages

This model may fail if the intervening organisation withdrawsthem prematurely. The weavers are normally not so much to run a company. It will take generation to train them to do businesses. Their next generation may not be interested to work in this sector. To convince the people to form a cooperative is hard.

Concept of social enterprise

Social enterprises are businesses that tackle social problems, improve communities, provide people access to employment and training or help the environment. According to Freer Spreckley, an enterprise may be called “social” if it is owned by those who work and/or reside in a given locality or is governed by registered social as well as commercial aims and is run co-operatively.

Another definition, given by Kim Alter, sees social enterprises as businesses created for a social purpose to mitigate or reduce a social problem or market failure, and to generate social value while showing innovation13 .

Social enterprise defines itself as an organization that:

  1. Are driven by public or community cause, be it social, cultural, environmental or economic
  2. Derive most of their income from trade, not donations or grants
  3. Use the majority (at-least 50%) of their profits to work towards their social mission.

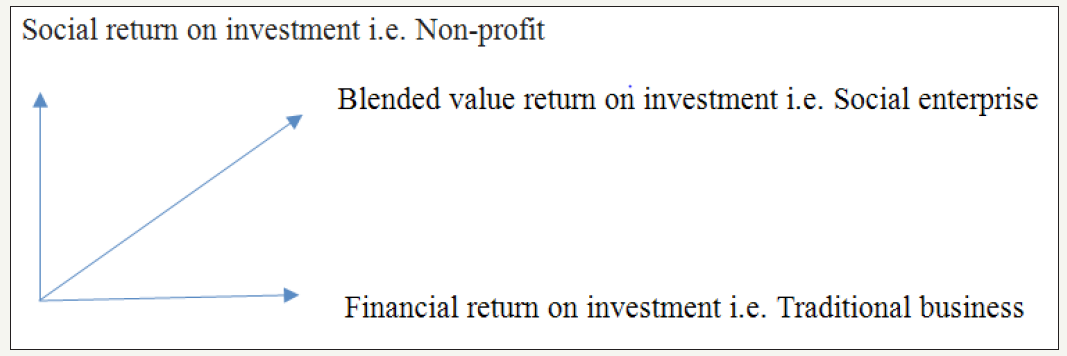
Aim:The aim of social enterprise is to achieve both a social return on investment and a financial return on investment thus working towards blending value return on investment(Figure 5).There are many non-profit organizations that operate social enterprises. Their aim is to fill a community need in the market, advance their mission and contribute to financial sustainability.

figure 5:


Models of social enterprise: There are three models of social enterprise

  1. Subsidized social enterprise:These businesses depend on subsidized funding to support operational costs. i.e. training subsidies.
  2. Self-sustaining social enterprise:These businesses do not receive any grants, though are able to cover operational costs fully with sales revenue.
  3. Profitable social enterprise:These businesses have income that exceeds expenses and are therefore profitable operation social enterprise.

Non-profit continuum14 (Figure 6)

Different kinds of social enterprise15 :

  1. Community Enterprises: Enterprises which serve a particular geographical community or community of interest and have representatives from the community on their board of directors.
  2. Social Firms: Aim to integrate people who might otherwise find it difficult in the mainstream job market, such as people with learning disabilities or mental health problems.
  3. Co-operatives: Organisation owned, controlled, and run for the benefit of their members.
  4. Credit Unions: These are community based financial institutions that provides savings and loan facilities for their members.
  5. Community Development Finance Institutions: They are the providers of loans and other types of investment primarily for social enterprises and other small businesses.
  1. Development Trusts: They are community enterprises which aim to develop a community, usually through the ownership and management of property.
  2. Public sector spin-outs: They are the independent social enterprises set up to deliver services that were previously provided by public sector organisations. They are also known as ‘externalised’ services.

figure 6:


  1. Trading arms of charities: These are set up to undertake trading activity in order to raise money for their charity parent company e.g. charity shops, catalogues, training and consultancy.
  2. Fair Trade organisations: They are committed to ensure that producers are paid a fair price for what they produce.
  3. Other types of social enterprise: Businesses with social objectives as central as their economic objectives.

Organisation could facilitate entrepreneur or could jump by itself from own funding or external funding to form a business entity to achieve a social goal of improving the life style the village level weaver and labourer offering them a fair wage and better employee benefit scheme such as health insurance, educational assistance to their children etc.

Conclusion

Since there is a very low demand for carpet in India due to which labourers have stopped working. There are several reasons for the labourers to prevent making carpets one of them is that the wages are very low and secondly they don’t have any market skills to improve their business. As the idea of making carpets was originated from India, there should be complete attention and focus given to the carpet industry. Different kinds of institutes have to be made where the students could be taught and given knowledge about the carpetsand this will bring employment for several people in India. If proper skills are provided to the ground level labourers then it will upgrade a better income and bring a better livelihood for them.

References

  1. Carpet Export Promotion Council (CEPC) (2018) Statistics on carpet exports from India. Department of Commerce, Government of India, India.
  2. India Brand Equity Foundation (IBEF) (2018) Carpet exports from India.
  3. Directorate General of Commercial Intelligence and Statistics (DGCI&S) (2018) Export import data bank.
  4. Karimi A (2016) Bhadohi carpet industry: Dynamics of social exclusion. PhD Thesis, Aligarh Muslim University, India.

For more articles in Fashion Technology open access journals
Please click on below link: https://crimsonpublishers.com/tteft/

Tuesday, February 22, 2022

Beneficial Effect of Qurs-E-Damavi, A Traditional Unani Formulation in Cyclophosphamide Induced Haematological Perturbations in Rats_Crimson Publishers

Beneficial Effect of Qurs-E-Damavi, A Traditional Unani Formulation in Cyclophosphamide Induced Haematological Perturbations in Rats by Gulam Mohammed Husain in journal of traditional and complementary medicine


Abstract

Qurs-e-Damavi (DM) is a polyherbal Unani formulation. It contains Rewand Chini (Rheum emodi), Zanjabeel (Zingiber officinale), Samagh-e-Arabi (Acacia arabica) and Hira Kasees (sulftes of Iron). It is used in conditions like anaemia. The aim of the current study was to validate the use of DM and its hydroethanolic extract (DME) in cyclophosphamide induced haemotoxicity in rats for the assessment of erythropoietic activity. DM was prepared as per classical methodology. Extract (DME) was obtained from crude formulation (DM) using extraction with ethanol and water (1:1; v/v). Haemotoxicity was induced by intraperitoneal administration of cyclophosphamide 3mg/kg bw in rats for seven consecutive days. Drug treatment was started from day-8 and continued till day-22. Blood samples were analysed on day-7 and day-22 using haematology analyser. Treatment with DM at 25 and 50mg/kg bw significantly reversed haemotoxicity induced by cyclophosphamide and haematological parameters of treated groups were comparable to vehicle control except a significant decrease (p<0.01) in WBC count at DM 25mg/kg bw group. DME 10mg/kg treatment normalized Hb and PLT count, however, RBC, WBC and HCT values were still significantly lower (p<0.05) compared to vehicle control. DME 20mg/kg treatment restored all hematological parameters except a significant decrease (p<0.001) in WBC count was persisted on day-22. Treatment with DM at 25 and 50mg/kg bw restored the haematological parameters in rats induced by cyclophosphamide. DME effectively restored haematological parameters only at the dose of 20mg/kg bw. Observed effect may be exerted by synergistic effect of the phytoconstituents of DM ingredients such as Rheum emodi, Zingiber officinale, Acacia arabica and iron. Present findings validate the indication of this traditional Unani formulation in the management of iron deficiency conditions like anaemia.

Keywords: Unani; Erythropoiesis; Polyherbal formulation; Haemopoiesis; Cyclophosphamide; Myelosuppression

Abbreviations: DME: Hydroalcoholic Extract; CP: Cyclophosphamide; TED: Therapeutic Equivalent Dose; Hb: Haemoglobin, RBC: Red Blood Cell; WBC: White Blood Cell; HCT: Haematocrit; PLT: Platelet

Introduction

Qurs-e-Damavi (DM) is a polyherbal Unani formulation. It contains Rewand Chini (Rheum emodi), Zanjabeel (Zingiber officinale), Samagh-e-Arabi (Acacia arabica) and Hira Kasees (sulfates of Iron). Though this traditional Unani formulation is being used clinically since long time (based on traditional knowledge), scientific data is lacking to support definite use of this Unani formulation. Therefore, the present study is designed to evaluate the effect of Qurs-e-Damavi and its 50% hydroalcoholic extract (DME) on haematopoiesis.

Materials and Methods

Effect of Qurs-e-Damavi and its 50% hydroalcoholic extract (DME) was evaluated in cyclophosphamide (CP) induced haematological perturbations in rats.

Preparation of the formulation

Qurs-e-Damavi (DM) was prepared in the GMP certified Pharmacy Section of National Research Institute of Unani Medicine for Skin Disorders, Hyderabad as per the composition which includes Rewand Chini (Rheum emodi), Zanjabeel (Zingiber officinale), Samagh-e-Arabi (Acacia arabica) and Hira Kasees (sulphates of Iron).

50% hydroethanolic extract of DM was prepared by Drug Standardisation Research Unit of the Institute. Briefly, DM was soaked in 1:1 mixture of water and ethanol (v/v) for 24 hrs with intermittent shaking, followed by filtration. The supernatant was discarded, and filtrate was evaporated to obtain dry extract (DME) which was weighed to calculate the yield and stored in desiccators till further use.

Experimental animals

Sprague Dawley rats (220±30g; Male) were used for the present study. Animals were procured from EDARA research foundation, Hyderabad. Rats were group housed in polysulfone cages in the temperature-controlled room maintained at the temperature of 22°C ± 3°C and relative humidity of 30-70%, with a 12:12 h light/dark illumination cycle. Study was approved by Institutional Animals Ethics Committee vide protocol no. 1034/ GO/Re/S/07/CPCSEA. National guidelines of laboratory animal care (CPCSEA) were followed throughout the experiment [1]. Rats were maintained on standard diet (SDS diet, England) and water ad libitum, unless mentioned otherwise. Corn cob bedding was used for housing the animals. Only male rats were used to avoid the influence of the estrus cycle on drug metabolism and/or efficacy. Rats were acclimatized to the laboratory conditions for one week before using them for experiment.

Dose selection and study design

Therapeutic dose of DM for adult human is reported as 250mg per day. Accordingly, as per body surface area conversion method [2], Therapeutic Equivalent Dose (TED) for rat is about 25mg/kg bw per day. Therefore, present study was performed at two dose levels of DM i.e., 25 and 50mg/kg bw/day. The percentage yield of hydroethanolic extract was found to be 40.46% (w/w). Accordingly, equivalent doses of extract (DME) for rats are 10 and 20mg/kg bw/ day.

Cyclophosphamide induced haemotoxicity

Hematopoietic activity was evaluated cyclophosphamide induced haemotoxicity model in rats [3]. Haemotoxicity was induced by intraperitoneal administration of cyclophosphamide (3mg/kg bw) for 7 consecutive days. Rats were divided into six groups (6 male animals in each group) and treated as Table 1.

Table 1: Treatment for rats.


DM and DME were suspended in 0.3% CMC every day using mortar pestle. The test drugs were orally administered as an aqueous suspension at the maximum volume of 2mL/100gm bw. The control rats were administered with vehicle (i.e., 0.3% CMC) only. Test drugs or vehicle were administered via stainless steel gavage, by calculating the individual dose based on the body weight of each rat.

On day 7, blood samples were collected from the retro-orbital plexus under isoflurane anesthesia and evaluated for various blood parameters using automatic haematology analyser. Hemoglobin (Hb), red blood cell count (RBC), white blood cell count (WBC), hematocrit (HCT) and platelet (PLT) counts were analyzed. Further, blood will be collected on the 22nd day and evaluated for the same hematological parameters.

Statistical analyses

Data from the experiments was expressed as mean ± standard error of mean (SEM). The mean difference between the control and treatment groups was analysed by one-way Analysis of Variance using Graph Pad prism (version 5) Graph Pad Software, Inc., CA, USA. p value<0.05 was considered as statistically significant.

Result

Rats treated with cyclophosphamide 3mg/kg for seven days (group II-VI) showed marked decrease (statistically significant in most of cases; refer to (Table 2) in haematological parameters such as RBC, Hb, WBC, HCT and PLT compared to vehicle control. Haematological perturbations persisted on day- 22 in cyclophosphamide control rats (group-II) and there was a significant reduction in RBC (p<0.01), Hb (p<0.05), WBC (p<0.05), and HCT (p<0.05) compared to vehicle control (Table 3). Treatment with DM at 25 and 50mg/kg bw significantly normalised these haematological parameters and all values were comparable to vehicle control except a significant decrease (p<0.01) in WBC count at DM 25mg/kg bw (4000±184.4 vs. 5840±201.5 of control). DME 10mg/kg treatment normalized Hb and PLT count, however, RBC, WBC and HCT values were still significantly lower (p<0.05) compared to vehicle control. DME 20 mg/kg treatment normalized all hematological parameters except a significant decrease (p<0.001) in WBC count was persisted on day-22 (3700±312.0 vs. 5840±201.5 of control).

Table 2: Effect of Damavi (DM) and its hydroethanolic extract (DME) on haematological parameters in cyclophosphamide- treated albino rats (after 7 days).


Table 3: Effect of Damavi (DM) and its hydroethanolic extract (DME) on haematological parameters in cyclophosphamide- treated albino rats (after 22 days).


Discussion

Present study was carried out to determine erythropoietic activity of traditional Unani formulation DM and its hydroethanolic extract DME. Cyclophosphamide induced model in rats was used to assess the effect of DM and DME on various haematological parameters. Cyclophosphamide induced toxicity model has been routinely used to evaluate the beneficial effect of herbal formulation in blood dyscrasia [3-5]. Cyclophosphamide is an antineoplastic drug that causes myelosuppression due to its metabolites which limits its clinical use [6]. The severity of myelosuppression increases with higher doses of cyclophosphamide. Cyclophosphamide induces myelosuppression by oxidative stress. Traditional medicines have been reported to reverse such changes [7,8].

In the present study, administration of cyclophosphamide at 3mg/kg for seven days (group II-VI) resulted in significant reduction of the RBC, Hb, HCT, WBC and PLT counts on day-7 as compared to vehicle control animals. Treatment with DM at 25 and 50mg/kg from day 8 to day 22 significantly normalised these haematological parameters. Oral administration of DME at the dose of 20mg/kg from day-8 to day-22 restored hematological alterations induced by cyclophosphamide except a significant decrease in WBC count. However, DME 10mg/kg did not effectively reversed haematological parameters induced by cyclophosphamide.

Observed beneficial effect of DM may be exerted by the presence of iron i.e., Hira Kasees (Sulphates of Iron) and atleast partly due to other constituents of DM such as ginger. It is reported that Rainbow trout (Oncorhyncus mykiss) fed with powdered ginger rhizome showed significant immune-stimulatory effect, increasing WBC, haematocrit, RBC count compared with the control group [9]. A recent study reported a significant increase in RBC, WBC, as well as the level of haematocrit and haemoglobin in fish (Cyprinus carpio; common carp) fed with ginger (Zingiber officinale) supplemented diet [10].

R. emodi another ingredient of DM has traditionally been used as diuretic, liver stimulant, purgative/cathartic, stomachic, anticholesterolemic, antitumour, antiseptic, immunomodulatory, as tonic and in menstrual disorders like dysmenorrhoea and menorrhagia (Zargar Hina). Several anthraquinone derivatives including emodin, aloe-emodin, physcion, chrysophanol, rhein, emodin glycoside and chrysophanol glycoside occur as the main chemical constituents [11,12]. R. emodi is reported as antioxidant and bioactivity-guided isolation of roots of R. emodi revealed eugenol, gallic acid, quercetin, rutin, epicatechin, desoxyrhapontigenin, rhapontigenin and mesopsin as major phenolic compounds responsible for the antioxidant activity [13]. Water soluble fraction of alcoholic extract of R. emodi is reported to have nephroprotective effect on all the proximal tubule segments possibly through antioxidant action of the tannins present in the fraction [14]. R. emodi also contains various micro and macro elements such as K, Ca, Fe, Mn, Na, Zn, Co, Li and Cu [15]. Aqueous extract of R. emodi was found to be safe up to 4000mg/kg/day in rats in a repeated dose 90-day oral toxicity study in rats [16]. Reported pharmacological profile of R. emodi including antioxidant potential clearly support the observed beneficial effect of DM in present study. A. arabica, another ingredient of DM is reported as a potent free radical scavenger and hepatoprotective and the polyphenol rich fraction is responsible for free radical scavenging activity [17,18]. Taken together, cumulative synergistic effect of individual ingredients is responsible for observed beneficial effect of this compound Unani formulation in cyclophosphamide induced haemotoxicity in rats. Findings of the study support that DM is a potentially effective therapy to overcome conditions like anaemia and leukocytopenia. Test formulation may be particularly useful as adjuvant therapy to overcome or curtail cyclophosphamideinduced damage during cancer chemotherapy. Further studies are warranted to explore the underlying mechanism DM and DME against cyclophosphamide induced toxicity.

Conclusion

Treatment with DM at 25 and 50mg/kg bw restored the haematological parameters in rats induced by cyclophosphamide. DME effectively restored haematological perturbations only at 20mg/kg bw. Observed effect may be exerted by the presence of iron and other constituents of DM such as flavonoids, terpenoids, and steroids. Present findings validate the indication of this traditional Unani formulation in the management of iron deficiency anaemia and DM could be a potential formulation for erythropoietic activity.

Acknowledgement

The authors would like to record their profound gratitude to Prof. Asim Ali Khan, Director General, Central Council for Research in Unani Medicine, Ministry of AYUSH, Government of India, for providing the necessary infrastructure and facilities. We would like to acknowledge Pathology Laboratory and Pharmacy section staff for their constant support.

References

  1. Anonymous (2018) Compendium of Committee for the Purpose of Control and Supervision of Experiments on Animals (CPCSEA). Ministry of Environment, Forest & Climate Change, Government of India, India.
  2. Reagan SS, Nihal M, Ahmad N (2008) Dose translation from animal to human studies revisited. FASEB J 22(3): 659-661.
  3. Pawar RS, Jain AP, Kashaw SK, Singhai AK (2006) Haematopoietic activity of asteracantha longifolia on cyclophosphamide-induced bone marrow suppression. Indian J Pharm Sci 68(3): 337-340.
  4. Udintsev SN, Schakhov VP (1991) Decrease of cyclophosphamide haematotoxicity by Rhodiola rosea root extract in mice with Ehrlich and Lewis transplantable tumors. Eur J Cancer 27(9): 1182.
  5. Cengiz M (2018) Hematoprotective effect of boron on cyclophosphamide toxicity in rats. Cell Mol Biol 64(5): 62-65.
  6. Ayhanci A, Yaman S, Appak S, Gunes S (2009) Hematoprotective effect of seleno-L-methionine on cyclophosphamide toxicity in rats. Drug Chem Toxicol 32(4): 424-428.
  7. Patra K, Bose S, Sarkar S, Rakshit J, Jana S, et al. (2012) Amelioration of cyclophosphamide induced myelosuppression and oxidative stress by cinnamic acid. Chem Biol Interact 195(3): 231-239.
  8. Meng X, Rong RH, Yu JZ, Keiichi A, Hiroshi K (2014) Effects of carnosine on cyclophosphamide-induced hematopoietic suppression in mice. Am J Chin Med 42(1): 131-142.
  9. Haghighi M, Rohani MS (2013) The effects of powdered ginger rhizome (Zingiber officinale) on haematological and immunological parameters of rainbow trout Oncorhynchus mykiss. Journal of Medicinal Plant and Herbal Therapy Research 1: 8-12.
  10. Mohammadi G, Rashidian G, Hoseinifar SH, Naserabad SS, Doan HV (2020) Ginger (Zingiber officinale) extract affects growth performance, body composition, haematology, serum, and mucosal immune parameters in common carp (Cyprinus carpio). Fish Shellfish Immunol 99: 267-273.
  11. Zargar BA, Masoodi MH, Ahmed B, Ganie SA (2011) Phytoconstituents and therapeutic uses of Rheum emodi ex Meissn. Food Chem 128(3): 585-589.
  12. Rehman H, Begum W, Anjum F, Tabasum H (2014) Rheum emodi (Rhubarb): a fascinating herb. Journal of Pharmacognosy and Phytochemistry 3(2): 89-94.
  13. Singh PP, Ambika, Chauhan SM (2013) Activity-guided isolation of antioxidants from the roots of Rheum emodi. Nat Prod Res 27(10): 946-949.
  14. Alam MM, Javed K, Jafri MA (2005) Effect of Rheum emodi (Revand Hindi) on renal functions in rats. J Ethnopharmacol 96(1-2): 121-125.
  15. Singh P, Negi JS, Rawat MS, Nee PGJ (2010) Quantification of mineral elements of Rheum emodi (Polygonaceae). Biol Trace Elem Res 138(1-3): 293-299.
  16. Ye BG, Feng Y, Wang S (2014) Scientific evaluation of the acute toxicity and 13-week subchronic toxicity of Rheum emodi rhizome extracts in Sprague Dawley rats. Food Chem Toxicol 66: 278-285.
  17. Sundaram R, Mitra SK (2007) Antioxidant activity of ethyl acetate soluble fraction of Acacia arabica bark in rats. Indian J Pharmacol 39(1): 33-38.
  18. Aadil KR, Barapatre A, Rathore N, Pottam S, Jha H (2012) Comparative study of in vitro antioxidant and antidiabetic activity of plant extracts of Acacia arabica, Murraya koeingii, Catharanthus roseus and Rouwolfia serpentina. International Journal of Phytomedicine 4(4): 543-551.

A Close Look at the Application of the Yin-Yang- Based Acupoint Pairs_Crimson Publishers

A Close Look at the Application of the Yin-Yang- Based Acupoint Pairs by Tong Zheng Hong in Advancements in Bioequivalence & Bioavailabi...